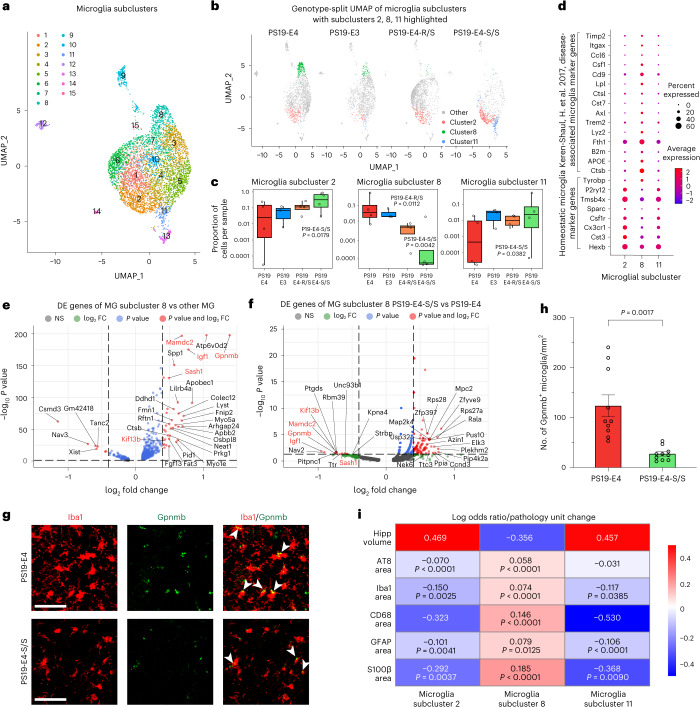
Fig. 8. The APOE4-R136S mutation increases disease-protective and decreases disease-associated microglial subpopulations.
a, UMAP projection of 15 microglia subclusters after subclustering hippocampal cell clusters 17 and 19 (Fig. 6a) from 10-month-old mice with different APOE genotypes. b, UMAP projection highlighting microglia subclusters 2, 8 and 11 for each mouse genotype group (PS19-E4, n = 4; PS19-E3, n = 3; PS19-E4-S/S, n = 4; PS19-E4-R/S, n = 4; n = mice). c, Box plot of the proportion of cells from each sample in microglia subclusters 2, 8, and 11 in PS19-E4 (n = 4), PS19-E3 (n = 3), PS19-E4-R/S (n = 4), and PS19-E4-S/S (n = 4) mice. The lower, middle and upper hinges of the box plots correspond to the 25th, 50th and 75th percentiles, respectively (see Fig. 6d for details). The LORs are the mean ± s.e.m. estimates of LOR for these clusters, which represents the change in the log odds of cells per sample from PS19-E3, PS19-E4-R/S or PS19-E4-S/S mice belonging to the respective clusters compared to the log odds of cells per sample from PS19-E4 mice. LOR versus PS19-E4 for subcluster 2: PS19-E4-S/S, 3.02 ± 1.28; subcluster 8: PS19-E4-R/S, −2.58 ± 1.02; PS19-E4-S/S, −3.36 ± 1.17; subcluster 11: 2.69 ± 1.33. d, Dot plot of normalized average expression of selected homeostatic and DAM marker genes for microglia subclusters 2, 8 and 11. e, Volcano plot for top 30 DE genes of microglia subcluster 8 versus other microglia subclusters. f, Volcano plot for top 30 DE genes of microglia subcluster 8 in PS19-E4-S/S versus PS19-E4 mice. g, Representative images of Gpnmb+Iba1+ microglia in the hippocampus of 10-month-old PS19-E4 (n = 10) and PS19-E4-S/S (n = 10) mice. Scale bars, 50 µm. h, Quantification of the number of Gpnmb+Iba1+ cells (per mm2) within the DG of hippocampus. Difference between groups in h was determined by unpaired, two-sided Welch’s t-test. i, Heat map plot of LOR per unit change in each pathological measurement for microglia subclusters 2, 8 and 11. P values in c are from fits to a GLMM_AM, and P values in i are from fits to a GLMM_histopathology; the associated tests are two-sided. In e,f, horizonal dashed line indicates P = 0.05, and vertical dashed lines indicate log2 fold change = 0.4. The unadjusted P values and log2 fold change values used were generated from the gene set enrichment analysis using the two-sided Wilcoxon rank-sum test as implemented in the FindMarkers function of the Seurat package. Gene names highlighted in red text indicate that they are selected marker genes for DAMs. All error bars represent s.e.m. AS, astrocyte; FC, fold change; MG, microglia; NS, not significant.

