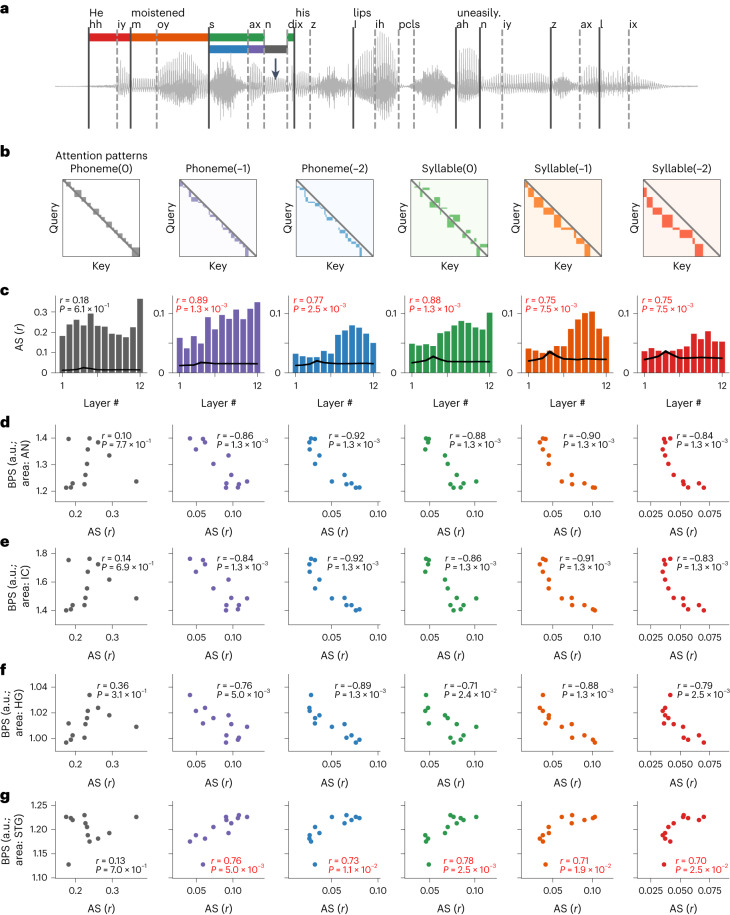
Fig. 4. Context-dependent computations explain brain correspondence across layers in the DNN.
a, Sample speech sentence text, waveform and phonemic annotations. The segmentations of phonemic and syllabic contexts to the current timeframe (black arrow) are marked in different colors: phoneme(0), current phoneme (gray); phoneme(−1), previous phoneme (purple); phoneme(−2), second to the previous phoneme (blue); syllable(0), current syllable (excluding the current phoneme; green); syllable(−1), previous syllable (orange); syllable(−2), second to the previous syllable (red). b, Template attention-weight matrices for different contextual structures as shown in a. ‘Query’ indicates the target sequence. ‘Key’ indicates the source sequence. Colored blocks correspond to different contexts. c, Averaged AS (Pearson’s correlation coefficient between attention weights and templates) across all English sentences for each transformer layer corresponding to each type of attention template. r values in the top left of each panel indicate the correlation between the AS and the layer index (n = 12 different layers, permutation test). Black line indicates the averaged AS from the same DNN architecture with randomized weights (mean ± s.e.m., n = 499 independent sentences). d–g, Scatter plots of AS versus BPS across layers for the AN (d), IC (e), HG (f) and STG (g) areas. Each dot indicates a transformer layer, and each panel corresponds to one type of attention pattern. The r and P values correspond to the AS–BPS correlation across layers (Pearson’s correlation, permutation test, one-sided. Red fonts indicate significant positive correlations).

