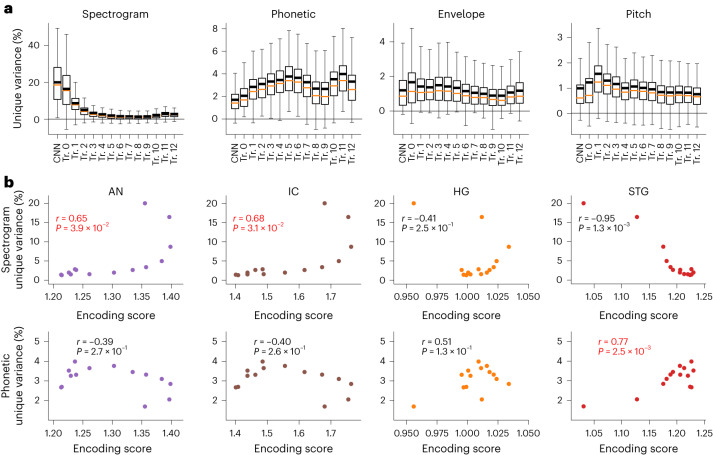
Fig. 6. Representations in neural networks demonstrate an acoustic-to-phonetic transformation hierarchy yet preservation of prosodic cues through DNN layers.
a, Distribution of the unique variance explained by each set of features across units in each DNN layer. n = 512 units in the last CNN layer and 768 units in each transformer layer. Box plot shows the first and third quantiles across electrodes (orange line indicates the median; black line indicates the mean value; and whiskers indicate the 5th and 95th percentiles). b, Top row, correlation between the BPS and the unique variance explained by spectrogram features in each layer; bottom row, correlation between the BPS and the unique variance explained by phonetic features in each layer. Each panel corresponds to one area, with each area represented by a different color (n = 14 layers, two-sided t test). Red fonts indicate significant positive correlations.

