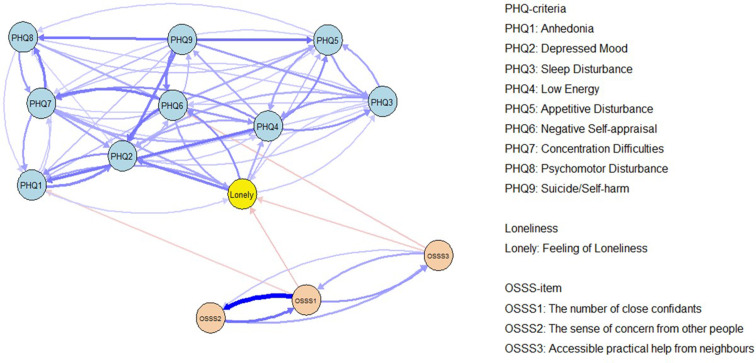
Figure 1.
A longitudinal network of social support, loneliness and depressive symptoms (N=4242). Arrows represent longitudinal association between different nodes. Elements for different constructs are in different colours. Nodes with higher connections are automatically clustered together by the Fruchterman-Reingold algorithm. Autoregressive edges and weaker edges with weights lower than 0.03 were excluded to ease visual interpretation as suggested by previous studies. OSSS, Oslo Social Support Scale; PHQ, Patient Health Questionnaire.

