

Abstract
Background
The 10-item Perceived Stress Scale (PSS-10) is a widely used measure of perceived stress that has been validated in various populations, yet with inconsistent results on its factor structure. The present study examines the reliability and validity of the PSS-10 in a population not previously examined: Chinese family caregivers of persons with schizophrenia, with a focus on factor analysis.
Methods
A sample of 449 family caregivers of persons with schizophrenia was recruited for psychometric testing of the scale. The factor structure of PSS-10 was tested by randomly dividing the sample into two groups for both exploratory factor analysis (EFA) and confirmatory factor analysis (CFA). The scale was further tested for internal consistency, test–retest reliability, convergent validity, discriminant validity and concurrent validity.
Results
EFA extracted two factors: perceived helplessness with six negative phrasing items and perceived efficacy with four positive phrasing items. CFA confirmed the structure of two factors with satisfactory model fit indices. Convergent validity was supported by high standard regression weight (0.78–0.92), average variance extracted (AVE=0.79–0.81) and composite reliability (0.88–0.94), while discriminant validity was confirmed by higher AVE estimates than the squared interconstruct correlations. The PSS-10 showed good internal consistency and test–retest reliability, with Cronbach’s alpha of 0.79 and intraclass correlation coefficient of 0.91, respectively. Concurrent validity was demonstrated by its significant positive correlations with stigma, depression and anxiety, as well as significant negative correlations with social support, family functioning and positive caregiving experiences.
Conclusion
The two-factor PSS-10 has good psychometric characteristics assessing the perceived stress of family caregivers of people with schizophrenia. The findings indicate that the PSS-10 can be used to measure perceived stress in future research and practice among caregivers of people with schizophrenia, and potentially, other caregiving samples.
Keywords: Psychometrics, PSYCHIATRY, Schizophrenia & psychotic disorders, Nursing Care
STRENGTHS AND LIMITATIONS OF THIS STUDY.
The first study to validate the most widely used 10-item Perceived Stress Scale (PSS-10) among a most stressed yet understudied population– family caregivers of people with schizophrenia.
The factor structure of PSS-10 was tested by randomly dividing the sample into two groups for both exploratory factor analysis (EFA) and confirmatory factor analysis (CFA).
An exhaustive testing of multiple psychometric properties of the PSS-10 including EFA, CFA, internal consistency, test–retest reliability, convergent validity, discriminant validity and concurrent validity.
The cross-sectional design of the study may preclude testing of sensitivity to change for the PSS-10.
Introduction
Schizophrenia is a severe, debilitating chronic psychiatric disorder that causes impairments in cognition, speech, thinking and emotional responsiveness.1 It impairs individuals’ social and occupational functioning, as well as limits their ability to carry out daily activities.2 For instance, Wiersma et al conducted a 15-year multicentre survey in Europe and found that social dysfunction was widespread and persistent in schizophrenia.3 Similar findings were also reported in China.4 Consequently, people with schizophrenia often require ongoing support and care, which in many Asian countries, is often provided by family members.5 In China, efforts have been made to establish community-based rehabilitation services for people with schizophrenia but with family members assuming the major role of caregiving.6 These family caregivers represent a large and invisible group to substitute for the under-resourced mental health service system to provide high-quality care to people with schizophrenia.7 Caring for people with schizophrenia can be a demanding activity that challenges the physical and mental health of family caregivers.8 As a result, family caregivers may report a high level of stress, which can lead to negative health outcomes and reduced quality of life.9
Studies have shown that the stress experienced by family caregivers of people with schizophrenia is higher than for caregivers of people with other prolonged illnesses, which is related to higher psychological distress, depression and anxiety.10 11 Caregivers’ stress may also result in conflict among family members and increased family dysfunction.8 12 These caregivers also report increased perceived stigma due to their loved one’s mental illness13–15 as well as insufficient social support.13 For example, family caregivers may report shame due to disruptive public behaviours of the family member with schizophrenia and seek to hide them from the public as much as possible.16 17 This can result in social isolation, lack of social support and social exclusion, which may further aggravate their stress.16 17 Thus, it is both important and meaningful to assess their stress levels using reliable and valid scales, which not only helps strengthen our understanding of their mental well-being for further intervention and support but also can guide the assessment of future intervention effects.
The Perceived Stress Scale (PSS) is one of the most widely used measures for assessing perceived stress in the world.18 19 The PSS measures the degree to which participants perceive unpredictability, lack of control, or overload in their live. The original PSS included 14 items (PSS-14), which were further abbreviated into two short versions: PSS-10 and PSS-4.18 20 Although the original PSS-14 showed sufficient validity and reliability, the shorter version (PSS-10) has superior psychometric properties and is recommended for research.21 The PSS-10 has been translated into various languages and validated in various countries, such as Sweden,22 France,23 Korea,24 Mexico,25 the USA,26 Arabia,27 Serbia,28 Germany,29 Viet Nam,30 Brazil31 and Thailand.32 The PSS-10 was first translated into Simplified Chinese (the language of the Chinese mainland) by Yang and Huang in 2003,33 and approved by its original developer Cohen.34 The Simplified Chinese version of the PSS-10 has been used with various populations including university students,35 elderly service workers36 and cardiac patients,37 but its psychometric properties among family caregivers of individuals with prolonged illnesses, such as with schizophrenia, has not been examined in Chinese communities. In addition, although there are abundant psychometric testing studies on PSS-10, inconsistencies exist in the results of its factor structure. Although the original developer considered it as a unidimensional measure,18 20 dozens of subsequent studies have proposed a two-factor structure,38–40 and there are also a few studies showing a three-factor structure.41 42
Given the lack of validation of PSS-10 among family caregivers of people with schizophrenia and the conflicting evidence on its factor structure, we conducted the current study to run a comprehensive psychometric testing on the PSS-10 among a Chinese community sample of family caregivers of people with schizophrenia. Specifically, we tested the factor structure of PSS-10 by randomly dividing the sample into two groups for exploratory factor analysis (EFA) and confirmatory factor analysis (CFA), respectively. In addition, we examined other psychometric properties of PSS-10 including internal consistency reliability, test–retest reliability, convergent validity, discriminant validity and concurrent validity.
Materials and methods
Participants and procedure
This cross-sectional study used baseline data from a large community sample who agreed to participate in an intervention to support family caregivers of people with schizophrenia.43 A total of 449 family caregivers of people with schizophrenia were recruited from 12 communities affiliated with the Changsha Psychiatric Hospital through the ‘686 programme’. ‘686 programme’ is China’s largest demonstration project aimed at integrating hospital and community services for serious mental illness.44 The Changsha Psychiatric Hospital has provided mental health services to the 12 communities, including free antipsychotic medicine delivery. Every month, a medical team from the Changsha Psychiatric Hospital went to each community health centre to distribute free medicine and run routine health check-ups for registered clients with serious mental illnesses. Inclusion criteria of family caregivers were: (1) caring for a family member registered in the ‘686 programme’ and satisfied the Chinese classification of Mental Disorders-3 or the International Classification of Schizophrenia-10 criteria for schizophrenia; (2) living with the care recipient for at least the last two years; (3) aged ≥18 years and (4) able to read and communicate and complete the questionnaire. Exclusion criteria included: (1) care recipient not registered in the 686 programme; (2) care recipient diagnosed with a mental illness other than schizophrenia, such as depression and epilepsy; (3) care recipient living alone; (4) family caregiver having a serious physical or mental illness and thus were unable to communicate and complete the interview and (5) family caregiver younger than 18 years. Our final sample size was 449 participants, satisfying the sample size requirement of at least 10 participants for each item in psychometric testing of scales.45
Data collection was conducted from May 2019 and September 2019. Family caregivers were approached during the free medicine delivery process by the medical team and invited to participate in the study. The medical team explained in detail about the study and referred interested caregivers to our research team. The research team fully explained the research to each family caregiver and fully informed the benefits and risks of participation, as well as their right to withdraw at any time. After providing written informed consent, the caregivers received face-to-face interviews conducted by our research team and completed a battery of questionnaires. The entire interview took approximately 20–40 min, and each participant was reimbursed RMB20 (US$2.80) for the completion of the questionnaire.
Patient and public involvement statement
None.
Instruments
Perceived Stress Scale
The 10-item PSS (PSS-10) is a self-assessed measure of psychological stress experienced over the past 30 days.18 20 The scale includes six negative items (items 1, 2, 3, 6, 9 and 10) assessing the degree of lack of control and negative reactions (also named as negative stress, perceived helplessness or perceived stress), as well as four positive items (items 4, 5, 7 and 8) assessing one’s ability to cope with existing stressors (also named as positive stress, perceived efficacy or perceived control).37 46 Each answer is scored on a 5-point Likert scale ranging from 0 (never) to 4 (very often) and the 4 positive items are reverse-coded so that higher scores indicate higher stress. The total score of PSS-10 ranges from 0 to 40, with higher scores indicating greater perceived stress and scores of 10 or more indicating moderate to high perceived stress.47 The Chinese version of PSS-10 used in the present study showed satisfactory internal consistency, with a Cronbach’s α of 0.79.
Perceived Devaluation and Discrimination Scale
The 12-item Perceived Devaluation and Discrimination Scale (PDD), originated from the Link disease stigma scale series, is a widely used scale for measuring perceived stigma.48–50 The PDD includes two factors: devaluation (5 items) and discrimination (7 items). Each item is scored on a 5-point Likert scale ranging from 1 (fully agree) to 5 (totally disagree). Items 1, 2, 3, 4, 8 and 10 are reverse-coded. The total score ranges from 12 to 60, with higher scores indicating higher levels of perceived stigma.51 The PDD showed good reliability with a Cronbach’s alpha of 0.78 in the original study.48 The Chinese version of PDD also showed good reliability in other studies.52 In the current study, the PDD showed acceptable internal consistency with a Cronbach’s alpha of 0.70.
Patient Health Questionnaire
The 9-item Patient Health Questionnaire (PHQ-9) is one of the most widely used screening tools for assessing depressive symptoms over the previous two weeks.53 Each item is scored on a 4-point Likert scale ranging from 0 (not at all) to 3 (nearly every day). The total score ranges from 0 to 27, with higher scores indicating more severe depressive symptoms and a cut-off value of 10 distinguishing between depression and non-depression. The PHQ-9 was first translated into Chinese by Yeung et al and showed good reliability and validity in the Chinese population.54 The Chinese version of PHQ-9 shows good internal consistency in the current study, with a Cronbach’s Coefficient of 0.93.
Generalised Anxiety Disorder Scale
The seven-item Generalised Anxiety Disorder scale (GAD-7) is one of the most widely used screening tools for assessing anxiety symptoms during the previous two weeks.55 Each item is scored on a 4-point Likert scale ranging from 0 (not at all) to 3 (nearly every day). The total score ranges from 0 to 21, with higher scores indicating more severe anxiety symptoms and a cut-off value of 10 distinguishing between anxiety and non-anxiety.56 The GAD-7 was first translated into Chinese by He et al57 and showed good reliability and validity in the Chinese population.58 The Chinese version of GAD-7 showed good internal consistency in the current study, with a Cronbach’s Coefficient of 0.95.
Multidimensional Scale of Perceived Social Support
The 12-item Multidimensional Scale of Perceived Social Support (MSPSS) is a widely used scale to measure the strength of support respondents received from three different sources: family, friends and significant others.59 Each item is scored on a 7-point Likert scale ranging from 1 (very strongly disagree) to 7 (very strongly agree). The total score ranges from 12 to 84, with higher scores indicating higher social support.59 60 The MSPSS was first translated into Chinese by Huang et al.61 It showed good reliability with a Cronbach’s alpha of 0.85–0.91in the original study.60 The Chinese version of MSPSS in the current study showed good internal consistency with a Cronbach’s Coefficient of 0.95.
Family Adaptation, Partnership, Growth, Affection and Resolve Index Scale
The five-item Family Adaptation, Partnership, Growth, Affection and Resolve Index Scale (APGAR) is a widely used scale to measure one’s satisfaction with their family functionality. Each item is scored on a 3-point Likert scale ranging from 0 (almost never) to 2 (almost always).62 The total score ranges from 0 to 10, with a higher score indicating higher satisfaction with family functioning. The APGAR has been widely used and well validated in many previous studies, with Cronbach α of 0.86 in the initial rating.63–65 The Chinese version of APGAR in the current study showed good internal consistency with a Cronbach’s Coefficient of 0.95.
Caregiving rewarding feelings
The 12-item caregiving rewarding feelings (CRF) measures the positive emotions of caregivers during the care of a family member with schizophrenia. CRF was initially developed based on qualitative interviews with 30 primary caregivers of people with schizophrenia, then validated in a larger sample. The development and validation of the CRF have been described elsewhere.66 67 Some sample items include whether caring for a family member with schizophrenia makes them become ‘more loving and patient’ ‘gain a lot of respect ’ ‘more active and optimistic, ’ ‘more responsible’. Each item is scored on a 4-point Likert scale ranging from 0 ‘never’ to 3 ‘nearly always’. The total score ranges from 0 to 36, with higher scores indicating more positive feelings. The CRF in the current study showed good reliability with a Cronbach’s alpha of 0.96.
Statistical analyses
Amos V.22.0 (SPSS) and IBM SPSS statistics V.23 (IBM) were used for statistical analyses. The sociodemographic characteristics of the samples were examined using descriptive statistics, including mean and SD for continuous variables, and frequency and percentage for categorical variables.
The factor structure of the PSS-10 was evaluated by both EFA and CFA. The total sample was randomly and equally divided into group 1 for EFA to build the model and group 2 for CFA to verify the model. Kaiser-Meyer-Olkin (KMO) and Bartlett’s test of sphericity were used to test whether our data were suitable for factor analysis.68 In EFA, principal component factor analysis with oblique rotation was conducted to assess the underlying structure of the PSS-10. Factors were extracted based on two criteria: (1) factors with eigenvalues greater than 1 and (2) items with factor loadings greater than 0.40.68 69
The theoretical model identified in EFA was further tested by CFA using the second sample. Kline and Byrne suggested the following CFA goodness-of-fit measures for model fit evaluation: goodness-of-fit index (GFI)>0.9, adjust GFI (AGFI)>0.9, comparing fit index (CFI)>0.9, non-normal fit index (NNFI)>0.90, standard root mean square residual (SRMR)<0.08, root mean square error of approximate (RMSEA)<0.08, Tucker-Lewis Index (TLI)>0.9.70–72 Once a good fit was established, construct validity was further tested by calculating the following indicators: standard regression weight (SRW), average variance extracted (AVE) and composite reliability (CR). According to Hair et al,73 SRW≥0.50, AVE≥0.50 and CR≥0.70 indicate good convergent validity, while AVE for each construct greater than the squared interconstruct correlations indicates good discriminant validity.
Internal consistency reliability was assessed using Cronbach α for the total scale of PSS-10 and its subscales. A Cronbach α level of ≥0.70 indicates good reliability.74 Test–retest reliability was calculated in a subsample of these participants (n=25) who were randomly assessed again 2 weeks later to allow calculation of the intraclass correlation coefficient (ICC). An ICC value of ≥0.75 indicates good test–retest reliability.75 76
Concurrent validity of the PSS-10 was assessed using Pearson product–moment correlations with expected significant positive correlations with perceived stigma (as measured by PDD), depression (as measured by PHQ-9) and anxiety (as measured by GAD-7); as well as expected significant negative correlations with social support (as measured by MSPSS), family functioning (as measured by APGAR) and positive caregiving experiences (as measured by CRF).
Results
Sample demographics
Table 1 shows the sociodemographic characteristics of the sample. The caregivers had a mean (SD) age of 60.90 (12.28) years. Most caregivers were spouses or parents (80.18%), not employed (85.6%), of middle and high school education (61.5%), and married/cohabited (75.7%). Over half were female (54.1%) and had an annual income of lower than RMB20 000 (56.6%).
Table 1.
Demographic characteristics of the participants (N=449)
| Characteristics | M (SD)/N(%) N=449 |
|
| Age (years) | 18–59 | 169 (37.6) |
| 60–100 | 280 (62.4) | |
| Mean (SD) | 60.90 (12.28) | |
| Gender | Male | 206 (45.9) |
| Female | 243 (54.1) | |
| Occupation | Employed | 65 (14.4) |
| Not employed | 384 (85.6) | |
| Education | Primary and below | 130 (29.0) |
| Middle and high | 276 (61.5) | |
| College and above | 43 (9.5) | |
| Marital status | Single | 19 (4.2) |
| Married/cohabited | 340 (75.7) | |
| Else (divorced/separated/windowed) | 90 (20.0) | |
| Kinship | Parents | 254 (56.57) |
| Spouse | 106 (23.61) | |
| Children | 29 (6.46) | |
| Siblings | 49 (10.91) | |
| Other | 11 (2.45) | |
| Income (RMB/year) | 20 000 or less | 254 (56.6) |
| 20 001–40 000 | 99 (22.0) | |
| 40 000 or more | 96 (21.4) |
Exploratory factor analysis
The underlying factor structure of the PSS-10 was first examined using EFA on the first half sample (N=218). KMO test showed a KMO value of 0.93, indicating good sampling adequacy. Bartlett’s test of sphericity (χ2=1896.319; df=45, p<0.001) also suggested that inter-item correlations were large enough to perform EFA.
Further EFA yielded a two-factor solution with two initial eigenvalues above 1 (3.48/1.80) and all items with factor loadings >0.40, which satisfied the predetermined factor extraction criteria (table 2). The two-factor structure accounted for 89.5% of the total variance in the sample. The first factor was labelled as ‘perceived efficacy’, with an explained variance of 65.6%, and included all 6 negative items, with factor loadings ranging from 0.70 to 0.82. The second factor was labelled as ‘perceived efficacy’, with an explained variance of 23.9%, and included all 4 negative items, with factor loadings ranging from 0.60 to 0.78. The interfactor correlation was 0.60, suggesting overall high intercorrelations between the two factors.
Table 2.
Exploratory factor analysis of the PSS-10 (N=218)
| Short item names | Mean (SD) | Components of the factors | Uniqueness | SRW | |
| Perceived helplessness | Perceived efficacy | ||||
| Nervous and stressed | 2.02 (1.15) | 0.82 | 0.22 | 0.83 | |
| Unable to control | 1.80 (1.20) | 0.78 | 0.24 | 0.78 | |
| Been upset | 1.75 (1.09) | 0.77 | 0.21 | 0.85 | |
| Could not overcome | 1.80 (1.20) | 0.75 | 0.13 | 0.90 | |
| Could not cope | 1.78 (1.09) | 0.71 | 0.22 | 0.83 | |
| Been angered | 1.74 (1.24) | 0.70 | 0.14 | 0.84 | |
| On top of things | 1.91 (1.18) | 0.78 | 0.25 | 0.91 | |
| Control irritations | 1.74 (1.11) | 0.66 | 0.24 | 0.84 | |
| Going your way | 2.30 (1.17) | 0.63 | 0.32 | 0.85 | |
| Felt confident | 1.68 (1.23) | 0.60 | 0.32 | 0.92 | |
| Eigenvalue | 3.48 | 1.80 | |||
| Variance (total=89.5%) | 65.6 | 23.9 | |||
| Inter-factor correlation | 0.60 | ||||
PSS-10, 10-item Perceived Stress Scale; SRW, standard regression weight.
Confirmatory factor analysis
The two-factor structure of PSS-10 identified in EFA was further tested using CFA on the second half sample (N=218). The two-factor structure was supported by the following goodness-of-fit statistics: χ2/df=2.628<3, p<0.001; GFI=0.963; AGFI=0.937; CFI=0.972; NNFI=0.961; TLI=0.961; RMSEA=0.061; SRMR=0.061. All these indexes indicated a good or acceptable model fit. Figure 1 shows a visualisation of the two-factor model.
Figure 1.
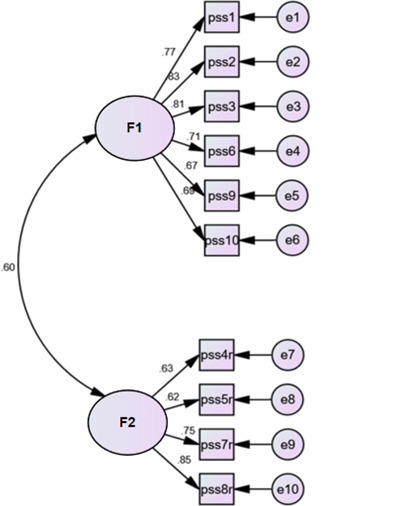
Standardised factor loadings for the two-factor model of the Perceived Stress Scale (PSS-10) (N=218). F1, perceived stress; F2, perceived efficacy.
Table 3 shows correlations between CFA factors, CR and AVE. The two subscales of the PSS-10 were all significantly associated with the total PSS-10 scale as well as each other, with correlation coefficients >0.50, indicating a large effect size. The CFA demonstrated good convergent validity of the PSS-10, with statistically significant SRW>0.50 (0.78–0.92, table 2), AVE>0.50 (0.79–0.81, table 3) and CR>0.70 (0.88–0.94, table 3). In addition, the CFA also confirmed good discriminant validity of the CRF, with each factor AVE estimate being higher than the squared interconstruct correlations with which it was associated (table 3).
Table 3.
Correlations between PSS-10 factors, CR and AVE (N=218)
| Factors | 1 | 2 |
| Perceived helplessness | 1 | |
| Perceived efficacy | 0.60 | 1 |
| AVE | 0.79 | 0.81 |
| CR | 0.94 | 0.88 |
AVE, average variance extracted; CR, composite reliability; PSS-10, 10-item Perceived Stress Scale.
Reliability
Internal consistency reliability, as measured by Cronbach’s alpha coefficient, was 0.79 for the total score of the PSS-10, 0.88 for the subscale of perceived helplessness and 0.79 for the subscale of perceived efficacy. These results indicate good internal consistency reliability. The ICC for the total score was 0.91 (p<0.001), exceeding the recommended standard of 0.75 and indicating good test–retest reliability.
Concurrent validity
The concurrent validity of PSS-10 was verified using correlational analysis. As shown in table 4, the scores of PSS-10 and its two subscales were significantly positively correlated with PDD (r: 0.07–0.16), PHQ-9 (r: 0.17–0.54) and GAD-7 (r: 0.14–0.62). The scores of PSS-10 and its two subscales were significantly negatively correlated with MSPSS-12 (r: −0.24 to −0.13), APGAR-5 (r: −0.35 to −0.19) and CRF-12 (r: −0.45 to −0.33). All the correlation coefficients were significant at p=0.01, which confirmed the concurrent validity of PSS-10.
Table 4.
Correlations of PSS-10 and its two subscales with other variables (N=449)‡
| Variables | 1 | 2 | 3 | 4 | 5 | 6 | 7 | 8 | 9 |
| PSS-10 | 1.00 | ||||||||
| Perceived helplessness—sub | 0.88* | 1.00 | |||||||
| Perceived efficacy—sub | 0.51* | 0.09 | 1.00 | ||||||
| PDD | 0.16* | 0.14* | 0.07 | 1.00 | |||||
| PHQ-9 | 0.54* | 0.54* | 0.17* | −0.02 | 1.00 | ||||
| GAD-7 | 0.62* | 0.65* | 0.14* | 0.01 | 0.72* | 1.00 | |||
| MSPSS-12 | −0.22* | −0.13* | −0.24* | −0.31* | −0.11† | −0.09 | 1.00 | ||
| APGAR-5 | −0.30* | −0.19* | −0.35* | −0.27* | −0.18* | −0.17* | 0.56* | 1.00 | |
| CRF-12 | −0.33* | −0.15* | −0.45* | −0.27* | −0.12* | −0.08 | 0.54* | 0.66* | 1.00 |
*p<0.01
†p<0.05
‡Spearman correlation using pairwise deletion for missing values.
APGAR, Family Adaptation, Partnership, Growth, Affection and Resolve Index Scale; CRF, caregiving rewarding feelings; GAD-7, Generalised Anxiety Dsorder Scale-7; MSPSS, Multidimensional Scale of Perceived Social Support; PDD, Perceived Devaluation and Discrimination Scale; PHQ-9, Patient Health Questionnaire-9; PSS, Perceived Stress Scale.
Discussion
PSS-10 is one of the most widely used scales for stress assessment and has been translated into more than 20 languages.21 However, PSS-10 has never been validated among family caregivers of people living with schizophrenia in China, an important yet understudied population that has been providing free and high-quality care to their loved ones with schizophrenia. In addition, factor analysis of the PSS-10 by previous studies has shown inconsistencies in its factor structures, with one, two and three factors being proposed. This study tested the psychometric properties of the Chinese version of PSS-10 among family caregivers of people with schizophrenia, with a focus on factor analysis by randomly dividing the sample into two groups for EFA and CFA.
Our results supported a two-factor structure of the PSS-10, with EFA yielding a two-factor structure, which was further verified by CFA with satisfactory model fit. Convergent validity was supported by high SRW, AVE and construct reliability (CR), while discriminant validity was confirmed by higher AVE estimates than the squared interconstruct correlations. Overall, the PSS-10 showed good internal consistency with a high Cronbach α coefficient, and good test–retest reliability with a high ICC. The concurrent validity of the PSS-10 was also supported by its significant positive correlations with stigma, depression and anxiety, and significant negative relationships with social support, family functioning and CRF. Thus, the two-factor PSS-10 demonstrated psychometrically sound properties for assessing the subjective experience of stress among caregivers of people with schizophrenia.
Our preliminary EFA showed a two-factor structure of PSS-10: perceived helplessness and perceived efficacy. Perceived helplessness includes six negative phrasing items (items 1, 2, 3, 6, 9 and 10) that reflect a lack of control and negative emotions, while perceived efficacy includes four positive phrasing items (items 4, 5, 7 and 8) that reflect confidence in dealing with things and positive emotions. Also, in line with our theoretical hypothesis, all items of PSS-10 had high factor loadings on their specified factors, further showing the robustness of the two-factor structure of the PSS-10. Subsequent CFA also showed favourable model fit indices, further corroborating the two-factor structure of PSS-10. In addition, the CFA also demonstrated good convergent validity of the CRF, with statistically significant SRW>0.50, AVE>0.50 and construct reliability (CR)>0.70, as well as good discriminant validity, with each factor AVE estimate being higher than the squared interconstruct correlations. Our findings were consistent with previous research showing a similar two-factor structure of PSS-10 in other populations, such as university students,35 55 77 general adult samples34 36 78–80 and clinical patients.37 81 What is noteworthy is that there has been wide debate about whether PSS-10 should be used as a full scale,20 31 34 or two separate subscales. Some researchers believe that the two subscales measure different components of the stress experience80 and have suggested using them separately.82 In the current study, the high correlation coefficient of 0.60 between the two subscales implies that the two factors are highly correlated yet not redundant with each other. As a result, it is suggested the PSS-10 can be used as a whole scale or as two subscales depending on the research questions under study.
The Cronbach’s α value for the total scale and two subscales of PSS-10 exceeded the recommended 0.70, indicating high internal consistency reliability. This finding is consistent with previous studies of Chinese34–36 and non-Chinese samples, such as Japan,83 South Korea,84 the USA,85 and Sweden.22 High test–retest reliability was supported by a high ICC of the total score, also showing the stability of PSS-10 in assessing perceived stress over time. However, test–retest reliability findings must be interpreted with caution because of the relatively small sample size. Future research may benefit from using a larger sample size to examine test–retest reliability.
The concurrent validity of PSS-10 was demonstrated by its significant positive correlations with PDD, PHQ-9 and GAD-7, as well as significant negative correlations with MSPSS12, APGAR and CRF. This finding is consistent with previous studies showing negative health outcomes related to high perceived stress among caregivers of people with schizophrenia, such as increased depression and anxiety, decreased family functioning and rewarding feelings, which may be related to their increased feelings of stigma and reduced social support11 13 26 Understanding the relationship between perceived stress and health outcomes of family caregivers may guide further family caregiver interventions.
The present study also had several limitations. First, the sample was recruited from 12 urban communities of Changsha city and thus may not be representative of other areas, especially rural communities. Future multicentre studies may address this issue. Second, the cross-sectional design of the study may preclude testing of sensitivity to change for the PSS-10; subsequent longitudinal research should examine this. Third, test–retest reliability was based on a relatively small sample size, which may be further confirmed in a larger sample.
Conclusion
In summary, the PSS-10 has good psychometric characteristics assessing the perceived stress of family caregivers of people living with schizophrenia, including good internal consistency, test–retest reliability, convergent validity, discriminant validity and concurrent validity. Both EFA and CFA supported a two-factor structure: perceived helplessness and perceived efficacy in the current population. Our findings provide reliable evidence for the use of PSS-10 in future studies to assess perceived stress among caregivers of people living with schizophrenia, and potentially, other caregiving samples.
Supplementary Material
Acknowledgments
The authors would like to thank all the families of the persons with schizophrenia for their participation in the WIFI programme and for openly sharing their feelings and experiences. We also thank the Changsha Psychiatric Hospital as well as the 12 community health centres for their collaboration and support.
Footnotes
Contributors: All authors have made substantial contributions to the study conception and design, data collection and analysis, as well as to the development and editing of the manuscript. S-JX is responsible for the overall content as the guarantor. TX, S-JX and YY contributed to the conception and design of the study, TX, S-JX, FZ, DW, XL and YY contributed to the research conduction and data collection, TX, S-JX and FZ contributed to data analyses, DW, XL, TX, S-JX and YY contributed to data interpretation. TX and S-JX drafted the article while TX, S-JX, FZ, DW, XL and YY critically appraised it and revised it. All authors approved the final version of the manuscript for submission and publication and agreed to be accountable for all aspects of the work.
Funding: This work was funded by a grant from the National Natural Science Foundation of China (Grant Number 71804197).
Competing interests: None declared.
Patient and public involvement: Patients and/or the public were not involved in the design, or conduct, or reporting, or dissemination plans of this research.
Provenance and peer review: Not commissioned; externally peer reviewed.
Data availability statement
Data are available on reasonable request. The datasets used and/or analysed during the current study are available from the corresponding author on reasonable request.
Ethics statements
Patient consent for publication
Not applicable.
Ethics approval
This study involves human participants and the institutional review board of Xiangya School of Public Health Central South University (No.: XYGW-2019-029) has approved and regulates the ethical execution of this research. Participants gave informed consent to participate in the study before taking part.
References
- 1.Benjamin J, Sadock VAS. Kaplan and Sadock’s Synopsis of psychiatry: behavioral sciences/clinical psychiatry. LWW, 2014. [Google Scholar]
- 2.Sakakibara E. What is mental illness? Journal of the Japan Association for Philosophy of Science 2017;44:55–75. 10.4288/kisoron.44.1-2_55 [DOI] [Google Scholar]
- 3.Wiersma D, Wanderling J, Dragomirecka E, et al. Social disability in schizophrenia: its development and prediction over 15 years in incidence cohorts in six European centres. Psychol Med 2000;30:1155–67. 10.1017/s0033291799002627 [DOI] [PubMed] [Google Scholar]
- 4.Jiang ZN. Modern Psychiatry. Beijing: Science Press, 1999. [Google Scholar]
- 5.Hsiao C-Y, Tsai Y-F. Factors of caregiver burden and family functioning among taiwanese family caregivers living with schizophrenia. J Clin Nurs 2015;24:1546–56. 10.1111/jocn.12745 [DOI] [PubMed] [Google Scholar]
- 6.Huang Y. Current situation and challenges of mental health in China. China Health Policy Research 2011;9:5–9. [Google Scholar]
- 7.Yu Y, Tang B-W, Liu Z-W, et al. Who cares for the schizophrenia individuals in rural China - a profile of primary family caregivers. Compr Psychiatry 2018;84:47–53. 10.1016/j.comppsych.2018.04.002 [DOI] [PubMed] [Google Scholar]
- 8.Suro G, Weisman de Mamani AG. Burden, interdependence, ethnicity, and mental health in caregivers of patients with schizophrenia. Fam Process 2013;52:299–311. 10.1111/famp.12002 [DOI] [PubMed] [Google Scholar]
- 9.Kızılırmak B, Küçük L. Care burden level and mental health condition of the families of individuals with mental disorders. Arch Psychiatr Nurs 2016;30:47–54. 10.1016/j.apnu.2015.10.004 [DOI] [PubMed] [Google Scholar]
- 10.Ampalam P, Gunturu S, Padma V. Padma V: a comparative study of caregiver burden in psychiatric illness and chronic medical illness. Indian J Psychiatry 2012;54:239–43. 10.4103/0019-5545.102423 [DOI] [PMC free article] [PubMed] [Google Scholar]
- 11.Chen QN, Liu L, Zhang D, et al. Impact of social support on quality of life and rehabilitation in patients with schizophrenia. 2016.
- 12.Friedmann MS, McDermut WH, Solomon DA, et al. Family functioning and mental illness: a comparison of psychiatric and nonclinical families. Fam Process 1997;36:357–67. 10.1111/j.1545-5300.1997.00357.x [DOI] [PubMed] [Google Scholar]
- 13.Corrigan PW, Morris SB, Michaels PJ, et al. Challenging the public stigma of mental illness: a meta-analysis of outcome studies. PS 2012;63:963–73. 10.1176/appi.ps.201100529 [DOI] [PubMed] [Google Scholar]
- 14.Sharac J, Mccrone P, Clement S, et al. The economic impact of mental health stigma and discrimination: a systematic review. Epidemiol Psichiatr Soc 2010;19:223–32. 10.1017/S1121189X00001159 [DOI] [PubMed] [Google Scholar]
- 15.Weimand BM, Hedelin B, Sällström C, et al. Hall-LORD Mljiimhn: burden and health in relatives of persons with severe mental illness: a norwegian cross-sectional study. Issues Ment Health Nurs 2010;31:804–15. 10.3109/01612840.2010.520819 [DOI] [PubMed] [Google Scholar]
- 16.Liang X, Guo Q, Luo J, et al. Anxiety and depression symptoms among caregivers of care-recipients with subjective cognitive decline and cognitive impairment. BMC Neurol 2016;16. 10.1186/s12883-016-0712-2 [DOI] [PMC free article] [PubMed] [Google Scholar]
- 17.Heflinger CA, Hinshaw SP. Stigma in child and adolescent mental health services research: understanding professional and institutional Stigmatization of youth with mental health problems and their families. Adm Policy Ment Health 2010;37:61–70. 10.1007/s10488-010-0294-z [DOI] [PubMed] [Google Scholar]
- 18.Cohen S, Kamarck T, Mermelstein R. A global measure of perceived stress. J Health Soc Behav 1983;24:385–96. [PubMed] [Google Scholar]
- 19.Reis D, Lehr D, Heber E, et al. The German version of the perceived stress scale (PSS-10): evaluation of dimensionality, validity, and measurement Invariance with exploratory and confirmatory bifactor modeling. Assessment 2019;26:1246–59. 10.1177/1073191117715731 [DOI] [PubMed] [Google Scholar]
- 20.Cohen S, Williamson GM. Perceived stress in a probability sample of the United States. 1988: 31–67.
- 21.Lee EH. Review of the psychometric evidence of the perceived stress scale. Asian Nursing Research 2012;6:121–7. 10.1016/j.anr.2012.08.004 [DOI] [PubMed] [Google Scholar]
- 22.Nordin M, Nordin S. Psychometric evaluation and normative data of the swedish version of the 10-item perceived stress scale. Scand J Psychol 2013;54:502–7. 10.1111/sjop.12071 [DOI] [PubMed] [Google Scholar]
- 23.Lesage FX, Berjot S, Deschamps F. Psychometric properties of the French versions of the perceived stress scale. Int J Occup Med Environ Health 2012;25:178–84. 10.2478/S13382-012-0024-8 [DOI] [PubMed] [Google Scholar]
- 24.Kim H-J. Reliability and validity of the 4-item version of the Korean perceived stress scale. Res Nurs Health 2016;39:472–9. 10.1002/nur.21745 [DOI] [PubMed] [Google Scholar]
- 25.González-Ramírez MT, Rodríguez-Ayán MN, Hernández RL. The perceived stress scale (PSS): normative data and factor structure for a large-scale sample in Mexico. Span J Psychol 2013;16:9.:E47. 10.1017/sjp.2013.35 [DOI] [PubMed] [Google Scholar]
- 26.Mitchell AM, Crane PA, Kim Y. Perceived stress in survivors of suicide: psychometric properties of the perceived stress scale. Res Nurs Health 2008;31:576–85. 10.1002/nur.20284 [DOI] [PubMed] [Google Scholar]
- 27.Chaaya M, Osman H, Naassan G, et al. Validation of the Arabic version of the Cohen perceived stress scale (PSS-10) among pregnant and postpartum women. BMC Psychiatry 2010;10:111. 10.1186/1471-244X-10-111 [DOI] [PMC free article] [PubMed] [Google Scholar]
- 28.Jovanovic V, Gavrilov-Jerkovic V. More than a (negative) feeling: validity of the perceived stress scale in Serbian clinical and non-clinical samples. Psihologija 2015;48:5–18. 10.2298/PSI1501005J [DOI] [Google Scholar]
- 29.Klein EM, Brähler E, Dreier M, et al. The German version of the perceived stress scale - psychometric characteristics in a representative German community sample. BMC Psychiatry 2016;16:10. 10.1186/s12888-016-0875-9 [DOI] [PMC free article] [PubMed] [Google Scholar]
- 30.Dao-Tran TH, Anderson D, Seib C. The Vietnamese version of the perceived stress scale (PSS-10): translation equivalence and psychometric properties among older women. BMC Psychiatry 2017;17:7. 10.1186/s12888-017-1221-6 [DOI] [PMC free article] [PubMed] [Google Scholar]
- 31.Reis RS, Hino AAF, Añez CRR. Rodriguez-Anez CR: perceived stress scale reliability and validity study in Brazil. J Health Psychol 2010;15:107–14. 10.1177/1359105309346343 [DOI] [PubMed] [Google Scholar]
- 32.Wongpakaran N, Wongpakaran T. The Thai version of the PSS-10: an investigation of its psychometric properties. Biopsychosoc Med 2010;4:6. 10.1186/1751-0759-4-6 [DOI] [PMC free article] [PubMed] [Google Scholar]
- 33.Yang T, Huang H. An epidemiological study on stress among urban residents in social transition period. Chinese Journal of Epidemiology 2003;24:760–4. [PubMed] [Google Scholar]
- 34.Wang Z, Chen J, Boyd JE, et al. Psychometric properties of the Chinese version of the perceived stress scale in policewomen. PLoS ONE 2011;6:e28610. 10.1371/journal.pone.0028610 [DOI] [PMC free article] [PubMed] [Google Scholar]
- 35.Lu W, Bian Q, Wang W, et al. Chinese version of the perceived stress scale-10: a psychometric study in Chinese university students. PLoS ONE 2017;12:e0189543. 10.1371/journal.pone.0189543 [DOI] [PMC free article] [PubMed] [Google Scholar]
- 36.Ng S-M. Validation of the 10-item Chinese perceived stress scale in elderly service workers: one-factor versus two-factor structure. BMC Psychol 2013;1:9. 10.1186/2050-7283-1-9 [DOI] [PMC free article] [PubMed] [Google Scholar]
- 37.Leung DY, Lam T, Chan SS. Three versions of perceived stress scale: validation in a sample of Chinese cardiac patients who smoke. BMC Public Health 2010;10:7. 10.1186/1471-2458-10-513 [DOI] [PMC free article] [PubMed] [Google Scholar]
- 38.Lee B, Jeong HI. Construct validity of the perceived stress scale (PSS-10) in a sample of early childhood teacher candidates. Psychiatry and Clinical Psychopharmacology 2019;29:76–82. 10.1080/24750573.2019.1565693 [DOI] [Google Scholar]
- 39.Almadi T, Cathers I, Hamdan Mansour AM, et al. An Arabic version of the perceived stress scale: translation and validation study. Int J Nurs Stud 2012;49:84–9. 10.1016/j.ijnurstu.2011.07.012 [DOI] [PubMed] [Google Scholar]
- 40.Michaelides MP, Christodoulou A, Kkeli N, et al. Factorial structure of the perceived stress scale and implications for scoring. European Review of Applied Psychology 2016;66:309–16. 10.1016/j.erap.2016.07.002 [DOI] [Google Scholar]
- 41.Bradbury J. Modelling stress constructs with biomarkers: the importance of the measurement model. Cems 2013:197–216. 10.12988/cems.2013.13017 [DOI] [Google Scholar]
- 42.Pangtey R, Basu S, Meena GS, et al. Perceived stress and its epidemiological and behavioral correlates in an urban area of Delhi, India: A community-based cross-sectional study. Indian J Psychol Med 2020;42:80–6. 10.4103/IJPSYM.IJPSYM_528_18 [DOI] [PMC free article] [PubMed] [Google Scholar]
- 43.Yu Y, Li T-X, Xi S-J, et al. n.d. Assessing a wechat-based integrative family intervention (WIFI) for schizophrenia: protocol for a stepped-wedge cluster. JMIR Res Protoc;9:e18538. 10.2196/18538 [DOI] [PMC free article] [PubMed] [Google Scholar]
- 44.Ma H. Integration of hospital and community services-the '686 Project'-Is a crucial component in the reform of China’s mental health services. Shanghai Arch Psychiatry 2012;24:172–4. 10.3969/j.issn.1002-0829.2012.03.007 [DOI] [PMC free article] [PubMed] [Google Scholar]
- 45.Mokkink LB, de Vet HCW, Prinsen CAC, et al. Terwee Cbjqolr: COSMIN risk of bias checklist for systematic reviews of patient-reported outcome measures. Qual Life Res 2018;27:1171–9. 10.1007/s11136-017-1765-4 [DOI] [PMC free article] [PubMed] [Google Scholar]
- 46.Eklund M, Bäckström M, Tuvesson H. Psychometric properties and factor structure of the swedish version of the perceived stress scale. Nordic Journal of Psychiatry 2014;68:494–9. 10.3109/08039488.2013.877072 [DOI] [PubMed] [Google Scholar]
- 47.Alharbi H, Alshehry A. Perceived stress and coping strategies among ICU nurses in government tertiary hospitals in Saudi Arabia: a cross-sectional study. Ann Saudi Med 2019;39:48–55. 10.5144/0256-4947.2019.48 [DOI] [PMC free article] [PubMed] [Google Scholar]
- 48.Link BG, Cullen FT, Frank J, et al. The social rejection of former mental patients: understanding why labels matter. American Journal of Sociology 1987;92:1461–500. 10.1086/228672 [DOI] [Google Scholar]
- 49.Link BG, Struening EL, Neese-Todd S, et al. Stigma as a barrier to recovery: the consequences of stigma for the self-esteem of people with mental illnesses. PS 2001;52:1621–6. 10.1176/appi.ps.52.12.1621 [DOI] [PubMed] [Google Scholar]
- 50.Perlick DA, Rosenheck RA, Clarkin JF, et al. Stigma as a barrier to recovery: adverse effects of perceived stigma on social adaptation of persons diagnosed with bipolar affective disorder. PS 2001;52:1627–32. 10.1176/appi.ps.52.12.1627 [DOI] [PubMed] [Google Scholar]
- 51.China NHCotpsRo . Documents of the general office of the Ministry of health. notice of the general office of the Ministry of health of the people’s Republic of China on the printing and distribution of the investigation and evaluation program on mental health indicators. 2010.
- 52.Li J, Fan Y, Zhong H-Q, et al. Effectiveness of an anti-stigma training on improving attitudes and decreasing discrimination towards people with mental disorders among care assistant workers in Guangzhou, China. Int J Ment Health Syst 2019;13. 10.1186/s13033-018-0259-2 [DOI] [PMC free article] [PubMed] [Google Scholar]
- 53.Spitzer RL, Kroenke K, Williams JBW. Patient Hlth questionnaire P: validation and utility of a self-report version of PRIME-MD - the PHQ primary care study. JAMA-J Am Med Assoc 1999;282:1737–44. 10.1001/jama.282.18.1737 [DOI] [PubMed] [Google Scholar]
- 54.Yeung A, Fung F, Yu SC, et al. Validation of the patient health questionnaire-9 for depression screening among Chinese Americans. Compr Psychiatry 2008;49:211–7. 10.1016/j.comppsych.2006.06.002 [DOI] [PMC free article] [PubMed] [Google Scholar]
- 55.Spitzer RL, Kroenke K, Williams JBW, et al. A brief measure for assessing generalized anxiety disorder - the GAD-7. Arch Intern Med 2006;166:1092–7. 10.1001/archinte.166.10.1092 [DOI] [PubMed] [Google Scholar]
- 56.Schalet BD, Cook KF, Choi SW, et al. Establishing a common metric for self-reported anxiety: linking the MASQ, PANAS, and GAD-7 to PROMIS anxiety. J Anxiety Disord 2014;28:88–96. 10.1016/j.janxdis.2013.11.006 [DOI] [PMC free article] [PubMed] [Google Scholar]
- 57.He XY, Li CB, Qian J, et al. Wu Wyjsaop: Reliability and validity of a generalized anxiety disorder scale in general hospital outpatients. 2010;22:200–3. [Google Scholar]
- 58.Huang YX, Luo D, Chen X, et al. Changes and determinants of health-related quality of life among people newly diagnosed with HIV in China: a 1-year follow-up study. Qual Life Res 2019;28:35–46. 10.1007/s11136-018-1998-x [DOI] [PMC free article] [PubMed] [Google Scholar]
- 59.Zimet GD, Dahlem NW, Zimet SG, et al. The multidimensional scale of perceived social support. Journal of Personality Assessment 1988;52:30–41. 10.1207/s15327752jpa5201_2 [DOI] [Google Scholar]
- 60.Zimet GD, Powell SS, Farley GK, et al. Psychometric characteristics of the multidimensional scale of perceived social support. J Pers Assess 1990;55:610–7. 10.1080/00223891.1990.9674095 [DOI] [PubMed] [Google Scholar]
- 61.Huang L, Jiang QJ, Ren WH. Coping style, social support, and psychosomatic symptoms in patients with cancer. Chinese Mental Health Journal 1996;10:160–1. [Google Scholar]
- 62.Smilkstein G. The family APGAR: a proposal for a family function test and its use by physicians. J Fam Pract 1978;6:1231–9. [PubMed] [Google Scholar]
- 63.Wang MW, Huang YY. Evaluating family function in caring for a geriatric group: family APGAR applied for older adults by home care nurses. Geriatr Gerontol Int 2016;16:716–21. 10.1111/ggi.12544 [DOI] [PubMed] [Google Scholar]
- 64.Lim ATC, Manching J, Penserga EG. Correlation between family APGAR scores and health-related quality of life of Filipino elderly patients with knee osteoarthritis. Int J Rheum Dis 2012;15:407–13. 10.1111/j.1756-185X.2012.01757.x [DOI] [PubMed] [Google Scholar]
- 65.Saameño JAB, Sánchez AD, Castillo J, et al. Validity and reliability of the family apgar family function test. Aten Primaria 1996;18:289. 10.1111/j.1467-6427.1996.tb00052.x [DOI] [PubMed] [Google Scholar]
- 66.Yu Y. Study on family burden and experiences of primary caregivers of schizophrenia in community. Central South University, 2016. [Google Scholar]
- 67.Tong X, Li T, Xi S, et al. Validating a caregiving rewarding feelings scale among family caregivers of those diagnosed with schizophrenia in China. J Psychiatr Ment Health Nurs July 24, 2023. 10.1111/jpm.12958 [DOI] [PubMed] [Google Scholar]
- 68.Hair J, Babin BYJ, Anderson RE. Multivariate data analysis 8th ed. Andover, Hampshire: Cengage, 2019. [Google Scholar]
- 69.Gabe KT, Jaime PC. Development and testing of a scale to evaluate diet according to the recommendations of the dietary guidelines for the Brazilian population. Public Health Nutr 2019;22:785–96. 10.1017/S1368980018004123 [DOI] [PMC free article] [PubMed] [Google Scholar]
- 70.Hu L, Bentler PM. Cutoff criteria for fit indexes in covariance structure analysis: conventional criteria versus new alternatives. Structural Equation Modeling: A Multidisciplinary Journal 1999;6:1–55. 10.1080/10705519909540118 [DOI] [Google Scholar]
- 71.Byrne BM. Structural equation modeling with AMOS, EQS, and LISREL: comparative approaches to testing for the factorial validity of a measuring instrument. International Journal of Testing 2001;1:55–86. 10.1207/S15327574IJT0101_4 [DOI] [Google Scholar]
- 72.Kline R, Kline RB, Kline R. Principles and practice of structural equation modeling. J Am Stat Assoc 2011;101. [Google Scholar]
- 73.Hair JF, Black WC, Babin BJ, et al. Multivariate data analysis: A global perspective 7th ed. UpperSaddle River, NJ: Pearson/Prentice Hall, 2010. [Google Scholar]
- 74.Nunnally JC. Psychometric theory. Am Educ Res J 1978;5:83. [Google Scholar]
- 75.Marx RG, Menezes A, Horovitz L, et al. A comparison of two time intervals for test-retest reliability of health status instruments. J Clin Epidemiol 2003;56:730–5. 10.1016/s0895-4356(03)00084-2 [DOI] [PubMed] [Google Scholar]
- 76.Fayers PM, Machin D. Quality of life: the assessment, analysis and interpretation of patient-reported outcomes Second Edition. 2007. 10.1002/9780470024522 [DOI] [Google Scholar]
- 77.Örücü MÇ, Demir A. Demir A: psychometric evaluation of perceived stress scale for Turkish university students. Stress and Health 2009;25:103–9. 10.1002/smi.1218 [DOI] [Google Scholar]
- 78.Siqueira Reis R, Ferreira Hino AA, Romélio Rodriguez Añez C. Perceived stress scale. J Health Psychol 2010;15:107–14. 10.1177/1359105309346343 [DOI] [PubMed] [Google Scholar]
- 79.Taylor JM. Psychometric analysis of the ten-item perceived stress scale. Psychol Assess 2015;27:90–101. 10.1037/a0038100 [DOI] [PubMed] [Google Scholar]
- 80.Baik SH, Fox RS, Mills SD, et al. Reliability and validity of the perceived stress scale-10 in Hispanic Americans with English or Spanish language preference. J Health Psychol 2019;24:628–39. 10.1177/1359105316684938 [DOI] [PMC free article] [PubMed] [Google Scholar]
- 81.Golden-Kreutz DM, Browne MW, Frierson GM, et al. Cutoff criteria for fit indexes in covariance STR stress scale. Assessment 2004;11:216–23. 10.1177/1073191104267398 [DOI] [PMC free article] [PubMed] [Google Scholar]
- 82.Ezzati A, Jiang J, Katz MJ, et al. Validation of the perceived stress scale in a community sample of older adults. Int J Geriatr Psychiatry 2014;29:645–52. 10.1002/gps.4049 [DOI] [PMC free article] [PubMed] [Google Scholar]
- 83.Mimura C, Griffiths P. A Japanese version of the perceived stress scale: cross-cultural translation and equivalence assessment. BMC Psychiatry 2008;8. 10.1186/1471-244X-8-85 [DOI] [PMC free article] [PubMed] [Google Scholar]
- 84.Lee EH, Chung BY, Suh CH, et al. Korean versions of the perceived stress scale (PSS-14, 10 and 4): psychometric evaluation in patients with chronic disease. Scand J Caring Sci 2015;29:183–92. 10.1111/scs.12131 [DOI] [PubMed] [Google Scholar]
- 85.Ingram PB, Clarke E, Lichtenberg JW. Confirmatory factor analysis of the perceived stress Scale-4 in a community sample. Stress Health 2016;32:173–6. 10.1002/smi.2592 [DOI] [PubMed] [Google Scholar]
Associated Data
This section collects any data citations, data availability statements, or supplementary materials included in this article.
Supplementary Materials
Data Availability Statement
Data are available on reasonable request. The datasets used and/or analysed during the current study are available from the corresponding author on reasonable request.