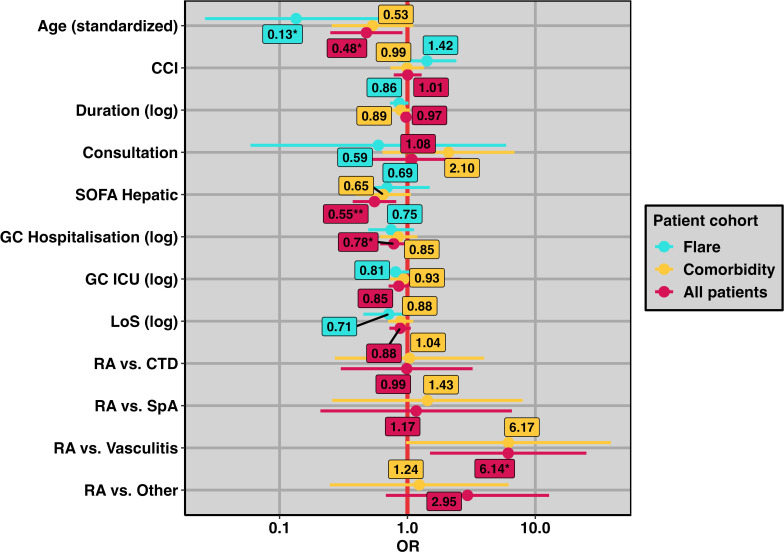
Figure 2.
Forest plot of multivariate logistic regression models. ORs are displayed as filled circles, and corresponding 95% CIs are displayed as bars (see also table 5). Each patient cohort is indicated by a different colour. The x-axis was log-transformed using a base of 10. The red vertical line indicates an OR of 1; *p<0.05; **p<0.01. CCI, charlson comorbidity index; consultation, consultation by a rheumatologist; CTD, connective tissue disease; GC ICU, glucocorticoid therapy prior admission to ICU; ICU, intensive care unit; LOS, length of stay; RA, rheumatoid arthritis; SOFA, sequential organ failure assessment score; SpA, seronegative spondyloarthropathies.

