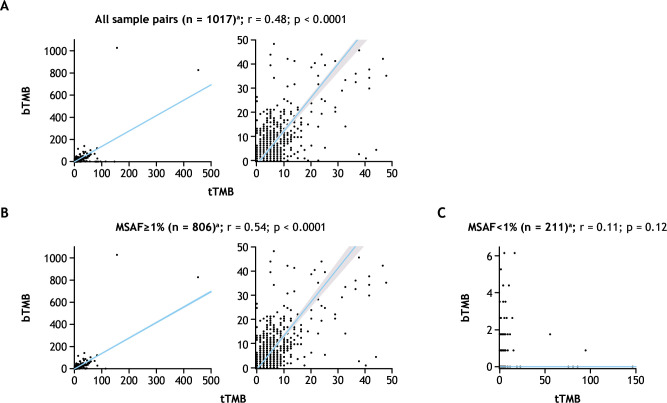
Figure 2.
Correlation of bTMB and tTMB for (A) all sample pairs; (B) sample pairs with MSAF≥1%; or (C) sample pairs with MSAF<1%. aRight-hand panel shows enlargement of the left-hand panel. Shaded area around the regression line in the right-hand panel shows the 95% CIs for Passing–Bablok regression analysis. bTMB, blood tumor mutational burden; MSAF, maximum somatic allele frequency; r, Spearman’s correlation coefficient; tTMB, tissue tumor mutational burden.

