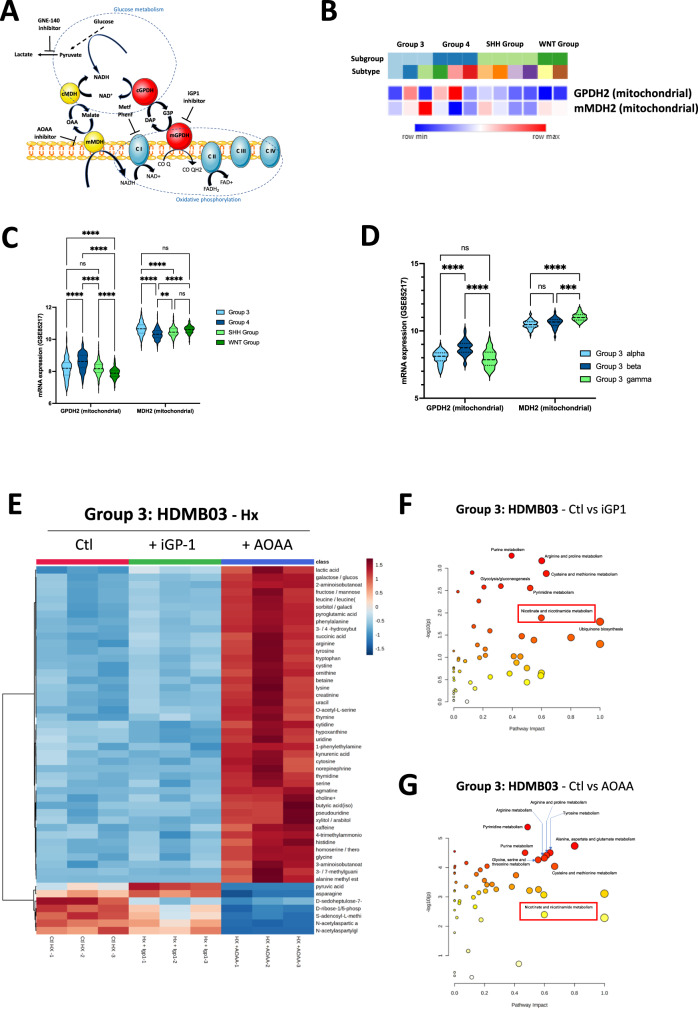
Fig. 1. Mitochondrial G3P and MAS shuttles are used differently by Group 3 under hypoxia.
A Schematic representation of the metabolic pathways driven by G3PS and MAS shuttles. Specific inhibitors are represented: iGP1 (mGPDH), AOAA (MDH2), and GNE-140 (LDHA). B Heatmap of the RNA expression of GPDH2 and MDH2 genes from GSE85217 comprising 763 primary samples from MB patients from Group 3, Group 4, SHH Group, and WNT Group MB [19]. Expression of the genes was compared using Phantasus (v1.19.3). C Violin plot of the RNA expression of GPDH2 and MDH2 genes from GSE85217 comprising 763 primary samples from MB patients from Group 3, Group 4, SHH Group and WNT Group MB [19]. Expression of the genes was compared using Prism 9 version 9.5.0. D Violin plot of the RNA expression of GPDH2 and MDH2 genes from GSE85217 comprising 763 primary samples from MB patients from Group 3 alpha, Group 3 beta and Group 3 gamma MB [19]. Expression of the genes was compared using Prism 9 version 9.5.0. C, D The 2-way ANOVA is used to determine statistically difference between the different groups. Not significant (ns), **p = 0.0014, ***p = 0.001 and ****p < 0.0001. E Steady-state metabolite profile of HDMB03 cells subjected to hypoxia for 72 h in the absence (Ctl - Hx), or presence of i-GP1 or AOAA. Intracellular metabolites from four independent samples per condition were profiled by LC/MS-MS, and those significantly altered in treated cells, relative to control cells, are shown as row-normalized heatmaps ranked according to log2 fold-change (treated/untreated). Pathway analysis of HDMB03 cells subjected to hypoxia in the absence (Ctl - Hx), or presence of i-GP1 (F) or AOAA (G).

