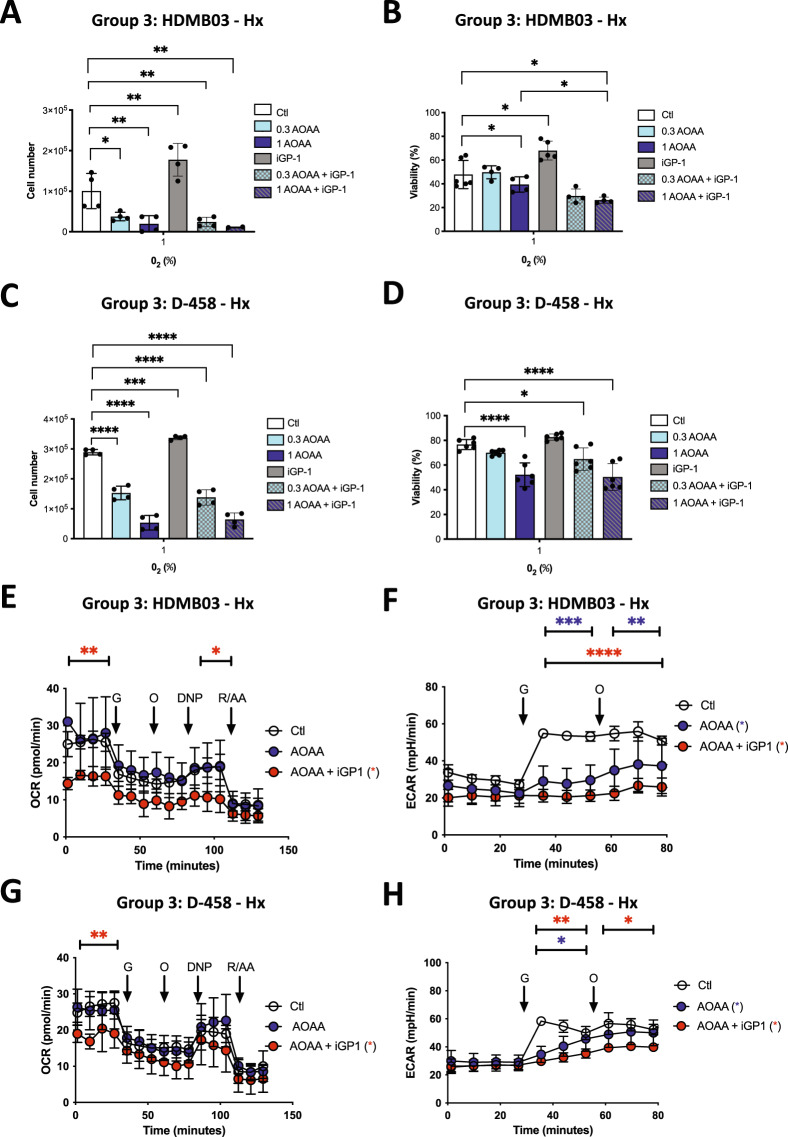
Fig. 3. Group 3 cells rely on both G3PS and MAS shuttles under Hx.
HDMB03 (A) and D-458 (C) cells were seeded at the same density and incubated in 1% O2 for 72 h in the absence (Ctl) or presence of AOAA (0.3 and 1 mM), iGP-1 (100 µM) or AOAA+iGP-1. Cell proliferation was measured using an ADAM cell counter. HDMB03 (B) and D-458 (D) cells were seeded at the same density and incubated in 1% O2 for 72 h in the absence (Ctl) or presence of AOAA (0.3 and 1 mM), iGP-1 (100 µM) or AOAA+iGP-1. A–D The ordinary one-way ANOVA is representative of at least four independent experiments. Not significant (ns), *p < 0.05, **p < 0.006, ***p = 0.001 and ****p < 0.0001. HDMB03 (E) and D-458 (G) cells. OCR was measured in real time with the XF96 analyzer. Cells were cultured for 24 h in Hx (1% O2) in the absence (Ctl) or presence of AOAA (1 mM) or AOAA+iGP-1 (100 µM). Cells were deprived of glucose for 1 h, then glucose (G), oligomycin (O), DNP, and Rotenone + Antimycin A (R/A) were injected at the indicated times. The graphs are representative of at least three independent experiments carried out in octuplicate. ECAR in Hx (1% O2) in the absence (Ctl) or presence of AOAA (1 mM) or AOAA+iGP-1 (100 µM) for 24 h of D-458 (F) and HDMB03 (H) cells was evaluated with the XF96 analyzer. Cells were deprived of glucose for 1 h, then glucose (G) and oligomycin (O) were injected at the indicated times. The graphs are representative of at least three independent experiments carried out in octuplicate. E–H Blue star (*) represents the statistical differences between AOAA and control, red star (*) between AOAA + iGP1. The 2-way ANOVA is representative of at least three independent experiments. *p < 0.05, **p < 0.005 and ***p < 0.001.

