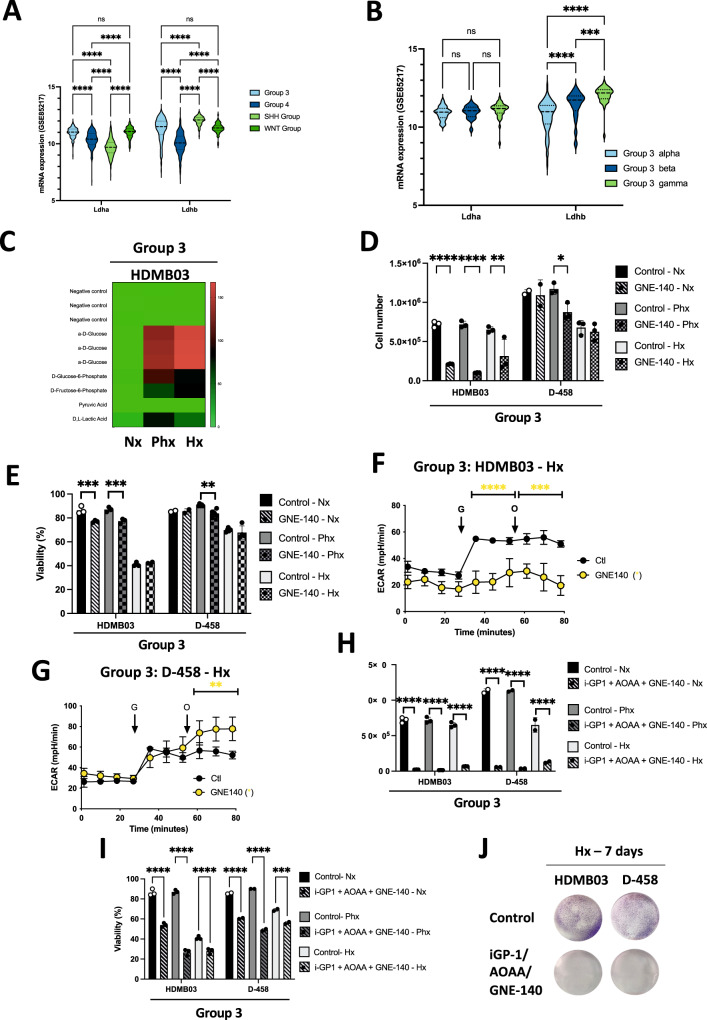
Fig. 4. Inhibition of LDHA in combination with iGP1 and AOAA massively kills Group 3 MB cells.
A Heatmap of the RNA expression of GPDH2 and MDH2 genes from GSE85217 comprising 763 primary samples from MB patients from Group 3, Group 4, SHH Group and WNT Group MB [19]. Expression of the genes was compared using Phantasus (v1.19.3). B Violin plot of the RNA expression of LDHA and LDHB genes from GSE85217 comprising 763 primary samples from MB patients from Group 3 alpha, Group 3 beta and Group 3 gamma MB [19]. Expression of the genes was compared using Prism 9 version 9.5.0. A, B The 2-way ANOVA is used to determine statistically difference between the different groups. Not significant (ns), ***p = 0.0001 and ****p < 0.0001. C Heatmap showing the seven substrates that were differently metabolized by HDMB03 and ONS-76 in Nx, Phx and Hx. The color key scale for each substrate is based on dye reduction quantified by Omnilog units. A dark red color indicates strong positive substrate metabolization, a red color moderate metabolization and a green color indicates no substrate metabolization. D, E HDMB03 and D-458 cells were seeded at the same density and incubated in Nx, Phx and Hx for 72 h in the absence (Ctl) or presence of GNE-140 (5 µM). Cell proliferation (C) and viability (D) were measured using an ADAM cell counter. D and E The 2-way ANOVA is representative of at least three independent experiments. Not significant (ns), *p = 0.014, **p < 0.005, ***p < 0.001 and ****p < 0.0001. ECAR in Hx (1% O2) in the absence (Ctl) or presence of GNE-140 (5 µM) for 24 h of HDMB03 (F) and D-458 (G) cells was evaluated with the XF96 analyzer. Cells were deprived of glucose for 1 h, then glucose (G) and oligomycin (O) were injected at the indicated times. The graphs are representative of at least three independent experiments carried out in octuplicate. Yellow star (*) represents the statistical differences between GNE-140 and control. H, I HDMB03 (H) and D-458 (I) cells were seeded at the same density and incubated in Nx, Phx and Hx for 72 h in the absence (Ctl) or presence of iGP-1 (100 µM) + AOAA (1 mM) + GNE-140 (5 µM). Cell proliferation (H) and viability (I) were measured using an ADAM cell counter. H and I The 2-way ANOVA is representative of at least three independent experiments. ***p < 0.001 and ****p < 0.0001. J Clonogenic assay of HDMB03 and D-458 cells. Cell lines were seeded at the same density and incubated in Hx (1% O2) for 7 days in the absence (Ctl) or presence of iGP-1 (100 µM) + AOAA (1 mM) + GNE-140 (5 µM).

