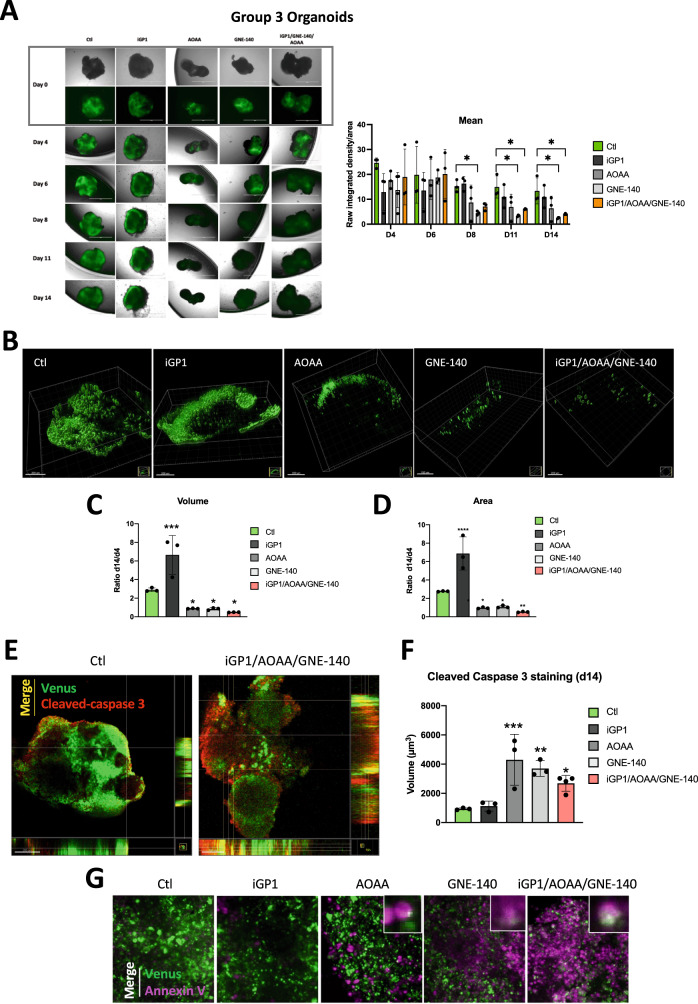
Fig. 5. Validation of drug response in human Group 3 MB tumor organoids.
A Brightfield and fluorescence images of cerebellar organoids at day 71 (Day 0 of treatment), day 75 (Day 4 of treatment), day 77 (Day 6 of treatment), day 79 (Day 8 of treatment), day 82 (Day 11 of treatment) and day 85 (Day 14 of treatment) electroporated at day 35 with pBase + pPBMYC + pPBOtx2 + pPBVenus. Right panel: Quantification of the mean (raw integrated density/area using Fiji) for each condition from day 4 (D4) to day 14 (D14). The ordinary one-way ANOVA is representative of at least three independent organoids. *p < 0.05. B Three-dimensional structures at day 14 obtained from confocal image series using IMARIS software; scale bars = 200 µm. Quantification of cell volume (C), and area (D) at day 4 and day 14. A ratio was calculated from day 14 to day 4. C, D The 2-way ANOVA is representative of at least three independent experiments. Not significant (ns), *p = 0.014, **p < 0.005, ***p < 0.001 and ****p < 0.0001. E Superimposition images where the presence of both fluors, Venus (tumor cells) and red (cleaved- caspase 3) is shown as a third color (yellow - merge). Human Group 3 MB tumor organoids have been treated in the absence (Ctl) or presence (iGP1/AOAA/GNE-140) of the combo. The orthogonal view is used to show virtual cross sections—one plotted along the x-axis and the other plotted along the y-axis; scale bars = 100 µm. F Quantification of cell volume day 14 after staining with cleaved caspase 3. The ordinary one-way ANOVA is representative of at least three independent experiments. *p < 0.05, **p < 0.005 and ***p < 0.001. G Superimposition images with the confocal (x20) where the presence of both fluors, Venus (tumor cells) and magenta (annexin V – Far red) is shown as a third color (white – merge) Human Group 3 MB organoids have been treated in the absence (Ctl) or presence of iGP-1, AOAA, GNE-140 and iGP1/AOAA/GNE-14.

