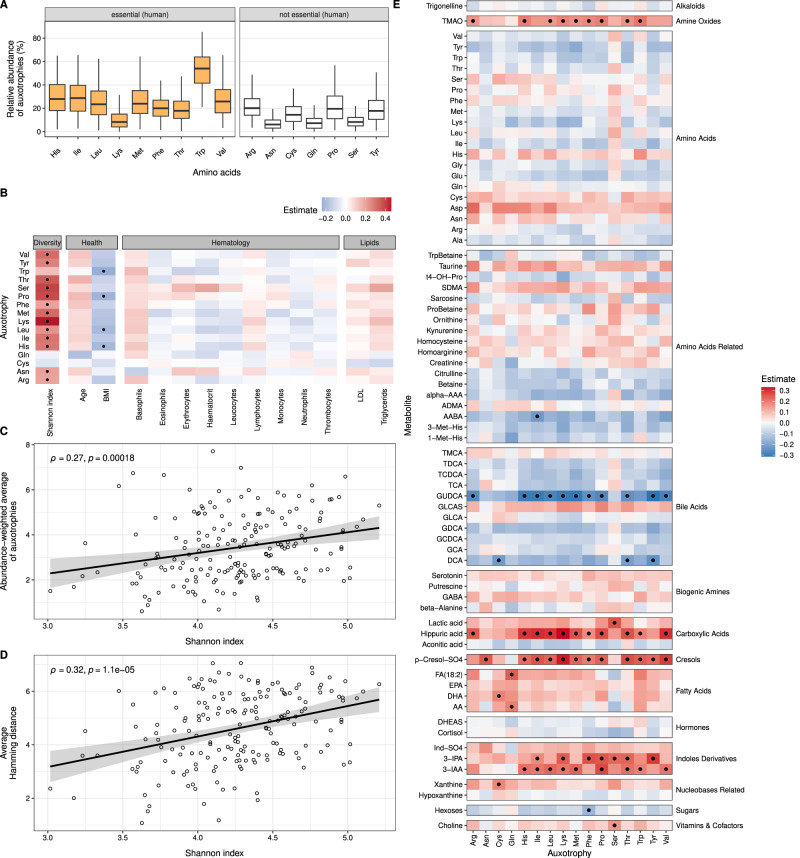
Fig. 4. Distribution of auxotrophies in human gut microbiomes from 185 healthy adults, their association with diversity, and serum metabolite levels.
A Boxplots display the abundance of amino acid auxotrophies in the human gut microbiome (n = 185 samples). B Partial Spearman correlation between the frequency of auxotrophic gut bacteria and serum levels of health markers and microbiome Shannon index. Dots indicate significant associations (FDR-corrected p values < 0.05, adjusted for the potential confounders age, sex, and BMI). C The abundance-weighted average of auxotrophies was calculated and correlated with the Shannon index (Spearman correlation, ρ = 0.27, p = 0.00018). D The average hamming distance was calculated to study the metabolic dissimilarity of auxotrophy profiles of coexisting genotypes and, therefore, potential cross-feeding interactions within the microbial communities. With the Spearman correlation, the association between the calculated average hamming distance and the Shannon index in the gut was estimated (ρ = 0.32, p = 0.00001). E Partial Spearman correlations between the serum levels of metabolites and the frequency of auxotrophic bacteria in the gut microbiome. Abbreviations for the serum metabolite levels can be found in Supplementary Table S5. Dots indicate significant associations (FDR-corrected p values < 0.05, adjusted for confounders age, sex, and BMI).

