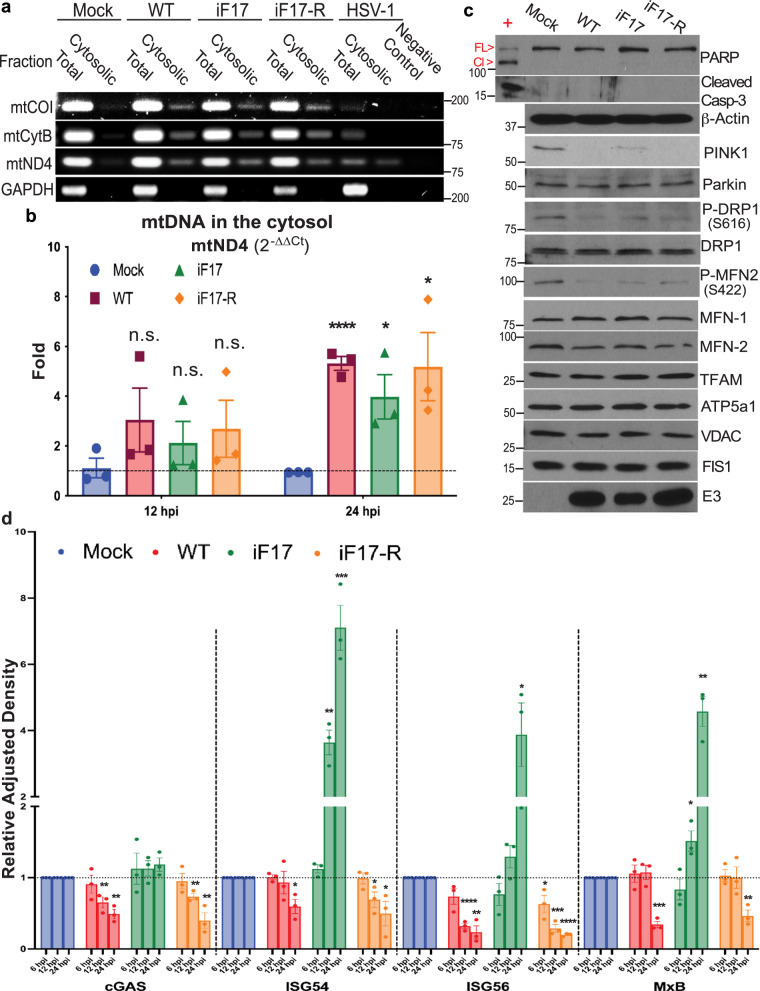
Fig. 2. mtDNA leakage and ISG activation in the absence of F17 are later-stage events.
a PCR analysis of fractionated lysates shows increased mtDNA in the cytosol of NHDFs infected with WT, iF17 or iF17R viruses, and degradation of mtDNA by HSV-1. Molecular Weight markers are shown in bp. b RT-qPCR measurement of mtND4 levels in the cell cytosol of NHDFs infected with the indicated viruses at MOI 5 for either 12 h or 24 h, presented as fold-change over mock using the 2-∆∆Ct method. n = 3 per group, multiple independent two-sided t-tests with the corresponding Mock for each time-point. Data are presented as mean values ± SEM. Note that although not statistically significant, cytosolic mtDNA levels are trending upwards in infected cells at 12 h.p.i. c NHDFs were infected at MOI 5 for 24 h. Levels and phosphorylation of mitochondrial proteins and apoptosis factors were assessed using the indicated antibodies. Cells treated with cycloheximide (CHX) served as a positive control for detection of caspase 3 (Casp-3) and PARP cleavage (FL=Full Length, Cl=Cleaved). Molecular Weight markers are shown in kDa. d Quantification of Western blots (see Supplementary Fig. 6 for examples) of cGAS and ISG levels in NHDFs infected with the indicated viruses at MOI 5 for 6 h, 12 h, or 24 h. n = 3 per group, multiple independent two-sided t-tests with the corresponding Mock for each protein. Data are presented as mean values ± SEM. To avoid clutter, only significant differences are indicated. a–d Representative of 3 or more biological replicates. For panels (b, d); n.s. = no significance, *p ≤ 0.05, **p ≤ 0.01, ***p ≤ 0.001, ****p ≤ 0.0001. Source data are provided as a Source Data file.

