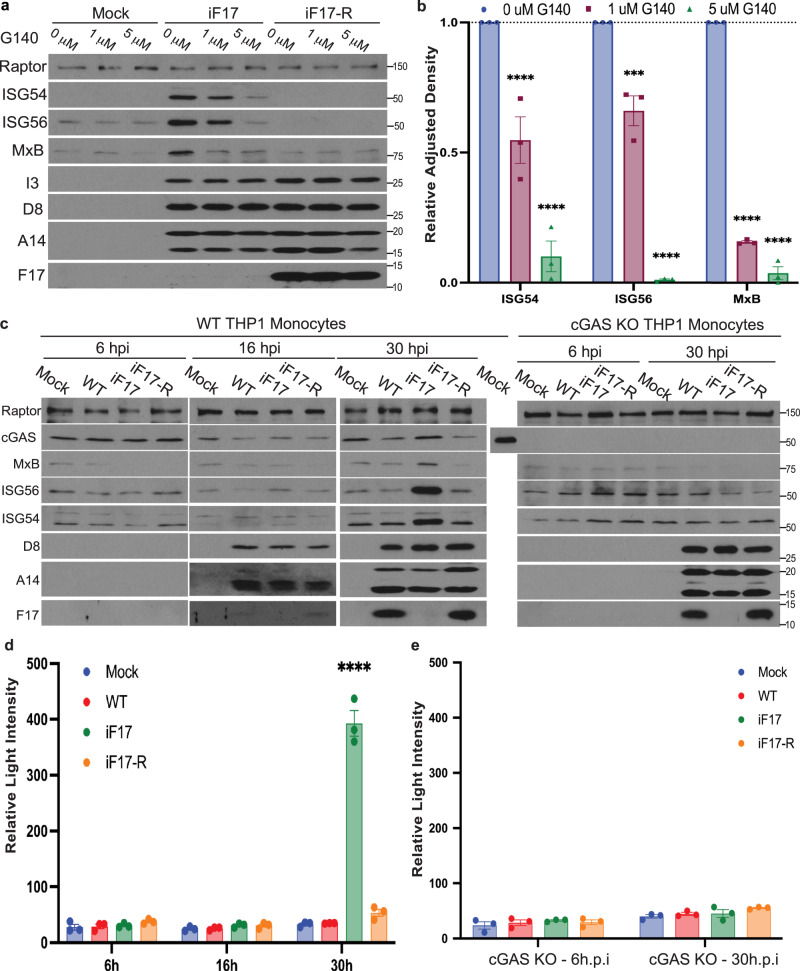
Fig. 3. cGAS is required for ISG responses to iF17 infection in NHDFs and THP1 monocytes.
a, b NHDFs were infected with the indicated viruses at MOI 5 and then treated at 6 h.p.i. with DMSO solvent control or the indicated concentrations of the cGAS inhibitor, G140. a Cells were lysed at 24 h.p.i. and analyzed by Western blotting using the indicated antibodies. Molecular Weight markers are shown in kDa. b Quantification of ISG levels in NHDFs described in a. n = 3 per group, 2-way ANOVA between concentrations followed by Sidak’s multiple comparisons tests. Data are presented as mean values ± SEM. c–e WT or cGAS knockout (KO) THP1 monocytes stably expressing an ISG54 promoter-driven Lucia Luciferase reporter were infected at MOI 5 for the indicated times. c Cells were lysed and analyzed by Western blotting using the indicated antibodies. As samples had to be run on separate gels, a WT THP1 cell lysate was run as a positive control for cGAS detection and to demonstrate the absence of cGAS in Knockout (KO) cells. Molecular Weight markers are shown in kDa. d, e Luciferase activity was measured in WT or cGAS KO THP1 monocytes infected as described in (c). n = 3 per group, 2-way ANOVA between time-points followed by Sidak’s multiple comparisons tests. Data are presented as mean values ± SEM. For panels (b, d, e); ns = no significance, ***p ≤ 0.001, ****p ≤ 0.0001. All data are derived from or representative of 3 or more independent experiments. Source data are provided as a Source Data file.

