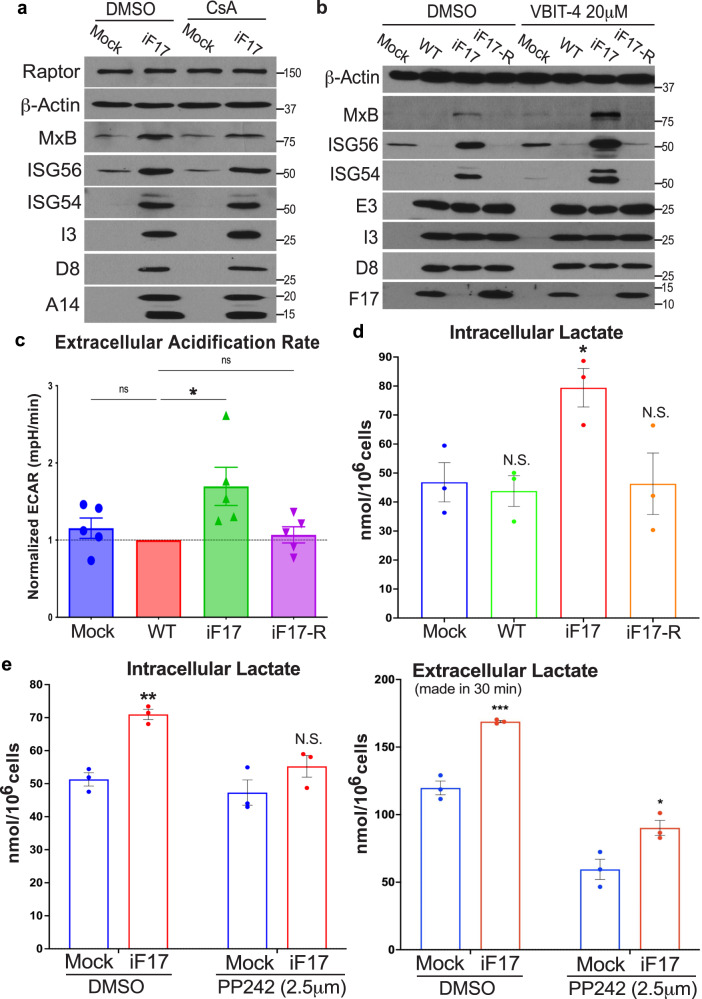
Fig. 7. Glycolysis is increased in response to infection in the absence of F17.
a–e NHDFs were infected at MOI 5 for 24 h. Cells were treated with DMSO or (a), 5 μM cyclosporin A (CsA) or (b), 20 μM VBIT-4 at the time of infection. Representative blots show effects of each inhibitor on ISGs and viral proteins. Molecular Weight markers are shown in kDa. c Extracellular acidification rate (ECAR) is increased in NHDFs infected with iF17. n = 5 per group, normalized to WT VacV-infected samples, independent two-tailed t tests. Data are presented as mean values ± SEM. d Intracellular lactate in NHDFs at 24 h.p.i. n = 3, independent two-tailed t tests with Mock. e Lactate production during responses to iF17 infection requires mTOR activity. DMSO or 2.5 μM of the mTOR inhibitor PP242 were added at 6 h.p.i. Intracellular (left) or released extracellular lactate in a 30 min period (right) was measured after medium change. n = 3 per group, independent two-tailed t tests within treatments. Data are presented as mean values ± SEM. For (c, d, e); ns = no significance, *p ≤ 0.05, **p ≤ 0.01, ***p ≤ 0.001. a–e Representative of 3 or more biological replicates. Source data are provided as a Source Data file.

