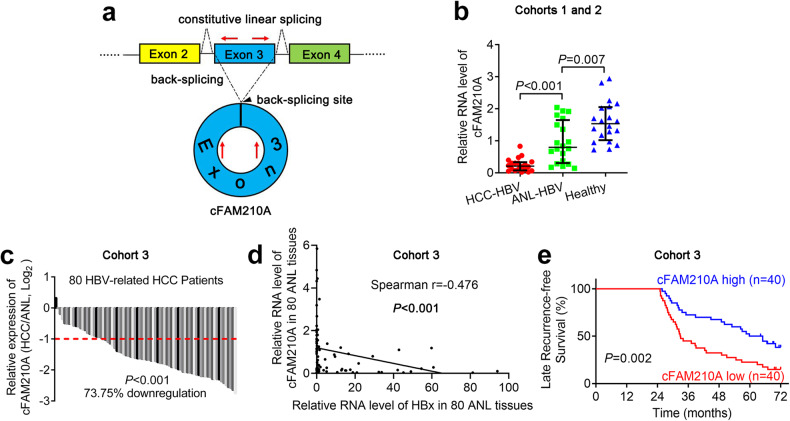
Fig. 2. Clinical significance of cFAM210A expression.
a Diagram of the pattern of cFAM210A biogenesis, with red arrows representing specific primers. b qRT‒PCR results showing the expression of cFAM210A in 20 healthy liver tissues (Cohort 1) and 20 paired HBV-related HCC and ANL tissues (Cohort 2). For comparisons between HCC-HBV and ANL-HBV samples, the Wilcoxon signed-rank test was used. For comparisons between ANL-HBV and healthy control samples, the Mann‒Whitney U test was used. c qRT‒PCR results comparing cFAM210A expression in HBV-associated HCC samples and non-HBV-related HCC samples. The Wilcoxon signed-rank test was used. d The correlation between the expression of HBx and that of cFAM210A in 80 ANL tissues was analyzed. e Kaplan‒Meier curve indicating the correlation between cFAM210A expression and cumulative late recurrence-free survival. The log-rank test was used. For (b), (c) and (d), ACTB was used as an endogenous control.

