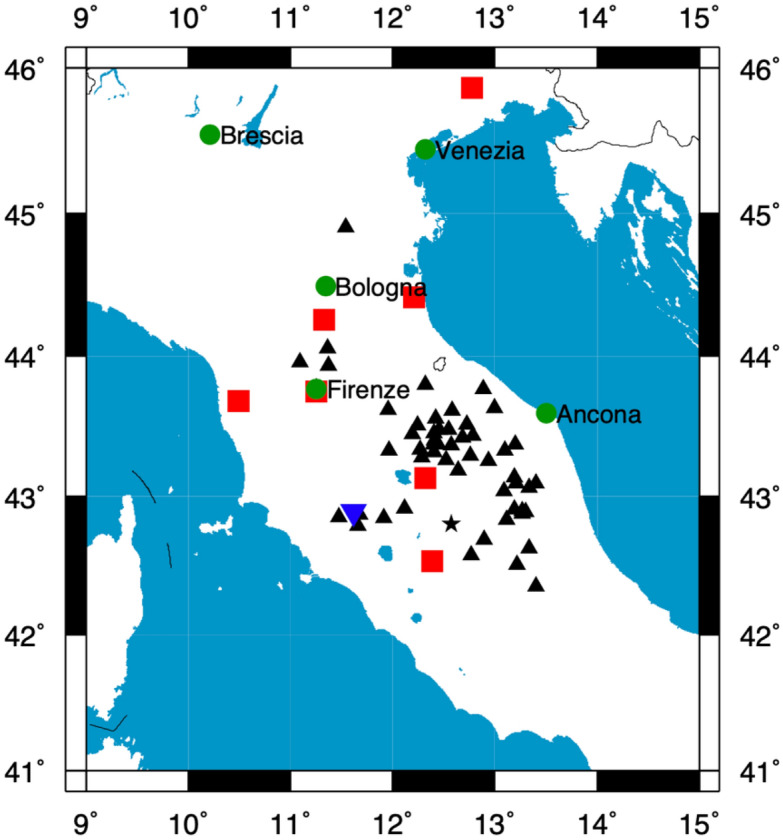
Figure 1.

Map of the region where the passage of the bolide was observed. Green circles identify the major town from where witnesses were reported by the media. Black triangles are seismic stations apart from station MOMA (black star). Finally, red squares are a portion of the cameras belonging to PRISMA networks that detected it, and reverse blue triangle is the location of the infrasound array. Blue reverse triangle is the location of the infrasound array on Mount Amiata. Map was generated using Generic Mapping Tools software, version 4.5.18 https://www.generic-mapping-tools.org/).
