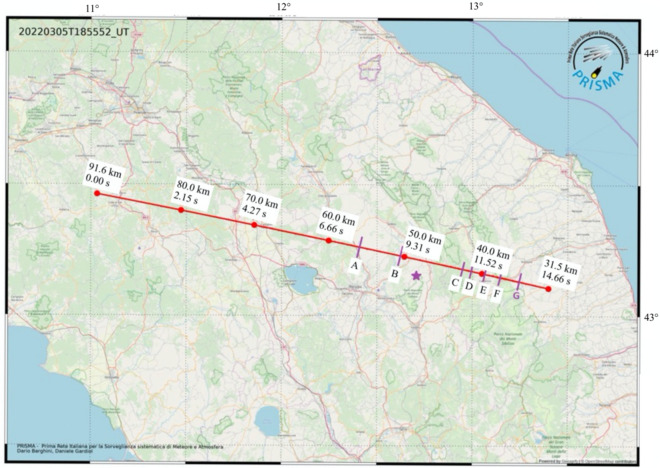
Figure 2.
Ground projection of luminous part of the atmospheric trajectory of the meteoroid. Red markers reference different steps for which the relative time since its first detection, and the corresponding height is computed. Purple ticks with labels mark the position of the different flares listed in Table 1. Map was generated using IDL (Interactive Data Language), version 8, by NV5 Geospatial Solutions, Inc.; 2023, https://www.nv5geospatialsoftware.com/Products/IDL. Background map data copyrighted OpenStreetMap contributors and available from https://www.openstreetmap.org.

