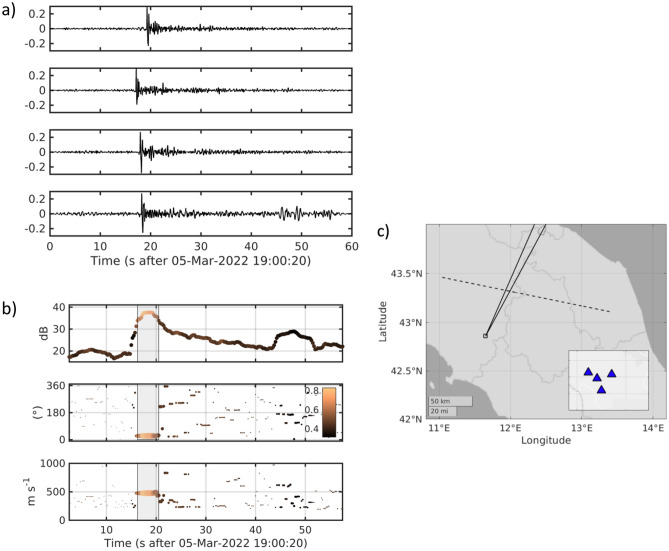
Figure 6.
(a) recordings of acoustic pressure at the infrasonic array displayed in panel (c). The y-axis unit is in Pa. (b) Results from beam-forming analysis. From top to bottom, the different panels illustrate the temporal evolution of the beam-power, back azimuth to the source, apparent velocity. Symbols are sized according to the beam power, and colored as a function of the multichannel coherence, according to the color scale reported in the middle panel. The shaded patches mark the region for which the beam power is larger than 50% of the largest power. (c) Location of the infrasonic array in central Italy; the azimuthal wedge corresponds to the range of back azimuth selected from the middle plot in panel (b). The inset shows the geometry of the array.

