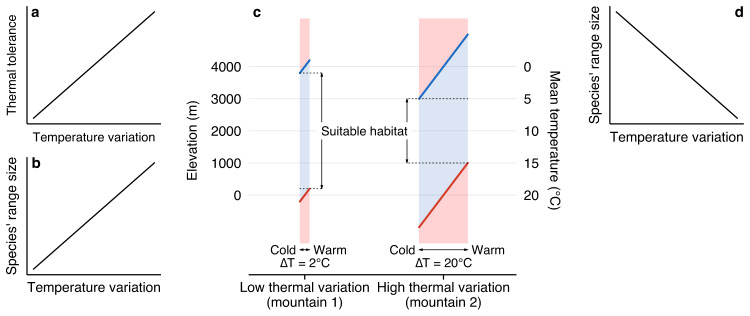
Fig. 1. Illustration of Stevens’ hypothesis and the temperature range squeeze hypothesis.
Based on the assumption that species have larger thermal tolerances in climatically variable habitats than in less climatically variable ones (a), Stevens predicted a positive relationship between species’ range sizes and temperature variability (b). Panel c represents the spatio-temporal temperature variation in mountains with different levels of temperature fluctuation as explained in the temperature range squeeze hypothesis. For simplicity, we used a constant lapse rate of 0.5°C. Shaded areas represent tolerable (blue) and lethal (red) temperatures for a species’ thermal tolerance spanning from 0 °C to 20 °C. The widths of the shaded areas represent temperature variability over time (ΔT), while the spatial variation in temperatures is described by the vertical axes. Thick blue and red lines indicate the 0 °C and 20 °C isotherms, respectively. The suitable habitat, which corresponds to species’ maximum theoretical elevation range in the absence of avoidance strategies such as dormancy, is defined by elevations in which the species does not encounter a limiting temperature (i.e. below 0 °C or above 20 °C) at any time of the given time scale. The elevation span of the suitable habitat is expected to shrink as thermal variability increases (c, compare mountains 1 and 2). Thus, a negative relationship between species’ range sizes and thermal variation is expected (d).

