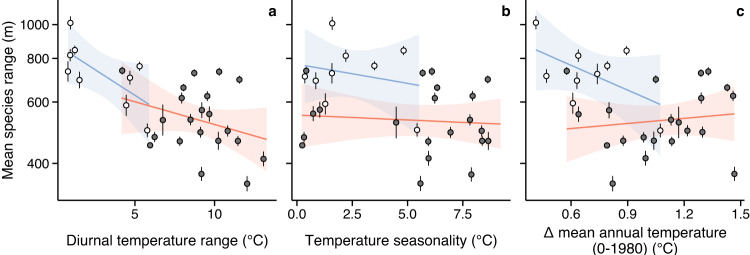
Fig. 3. Relationships between thermal variability and mean species’ elevation ranges in island and continental mountains.
Diurnal temperature range (a), temperature seasonality (b) and the variation of mean annual temperature from 0 to 1980 AD (c). Points represent the estimated mean elevation ranges with their respective standard error in each of the 30 standardized elevation gradients with length ≥ 2500 m. Colors indicate island (white dots, blue regressions) and continental (dark gray dots, orange regressions) mountains. Source data are provided as a Source Data file.

