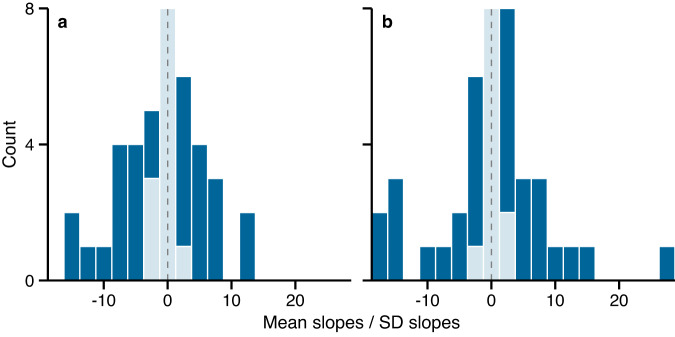
Fig. 4. Results from the local-scale analyses.
Responses of species’ elevation ranges to diurnal temperature range (a) and temperature seasonality (b) within each of the 44 mountains used in the study. Histograms are of mean slope terms divided by their standard deviation from the 95% credible interval for the local-scale analyses. Colors indicate whether the 95% credible interval includes 0 (light blue) or not (dark blue). Dashed lines indicate 0. Source data are provided as a Source Data file.

