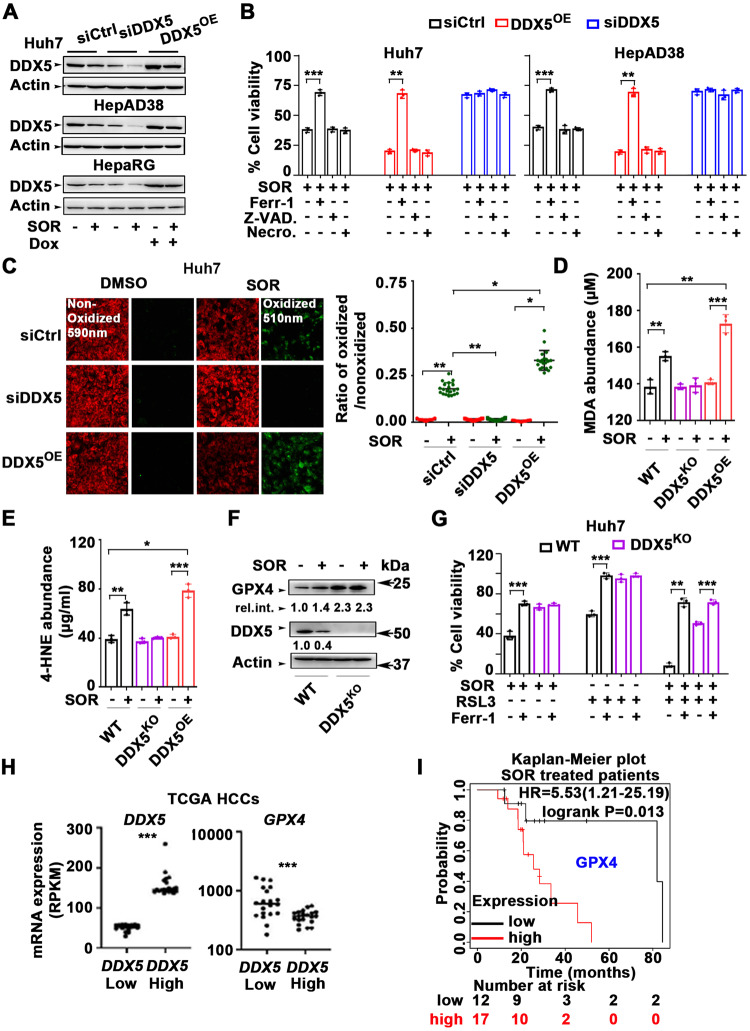
Fig. 4. DDX5 regulates ferroptosis in sorafenib-treated cells.
A Immunoblots of DDX5 in indicated cell lines. Huh7, HepAD38, and HepaRG cell lines transfected with siCtrl or siDDX5 for 24 h, followed by addition for 24 h of SOR (10 µM for Huh7 and 15 µM for HepAD38 and HepaRG cell lines). For DDX5OE, indicated Dox-inducible-DDX5 cell lines were grown with Dox (1.0 µg/ml) for 48 h, and SOR for the last 24 h. A representative immunoblot is shown, n = 3 Quantification of immunoblots by ImageJ software shown in supplementary Fig. S4A. B Cell viability of Huh7 and HepAD38 cells under conditions of siCtrl, siDDX5 or DDX5OE as described in (A), treated with SOR, ±10 µM ferrostatin-1 (Ferr-1), ±Z-VAD-FMK (10 µM) or ±necrosulfonamide (4.0 µM) for 24 h. Data expressed as mean ± SEM, n = 3. *p < 0.05, **p < 0.01 by unpaired t-test. C Fluorescence microscopy of C11-BODIPY using Huh7 cells, under conditions of siCtrl, siDDX5, or DDX5OE as described in (A), treated ±SOR (10 µM) for 24 h. (Right panel) Quantification by ImageJ software of the ratio of oxidized (510 nm)/non-oxidized (590 nm) C11-BODIPY. Data expressed as mean ± SEM from >1000 cells per condition. *p < 0.05, ** p < 0.01 by unpaired t-test. D MDA abundance (µM) quantified using lysates from Huh7 wild type (WT), DDX5KO, and DDX5OE cells treated as described in (A), without (−) or with (+) SOR for 24 h. Data are expressed as SD, n = 3. E 4-HNE abundance (µg/ml) quantified using lysates from WT, DDX5KO, and DDX5OE Huh7 cells treated as described in (A), without (−) or with (+) SOR for 24 h. Data are expressed as SD, n = 3. F Immunoblots of GPX4 and DDX5, as indicated, using lysates from WT and DDX5KO Huh7 cells grown without (−) or with (+) SOR for 24 h. Relative intensity is quantified vs. actin. A representative experiment is shown from n = 3. G Cell viability of WT and DDX5KO Huh7 cells treated with SOR, RSL3 (0.5 µM) or Ferr-1 (10 µM), as indicated, for 24 h. Data expressed as mean ± SEM, n = 3. *p < 0.05, **p < 0.01 by unpaired t-test. H Dot plots showing expression of DDX5 and GPX4 mRNAs in HCCs from TCGA with lowest vs. highest DDX5 expression. Twenty HCCs were analyzed per group. Median highlighted, ***p < 0.001. I Kaplan–Meier survival plots for GPX4 expression of SOR treated patients with HCC. HCC samples (n = 29) are from TCGA.

