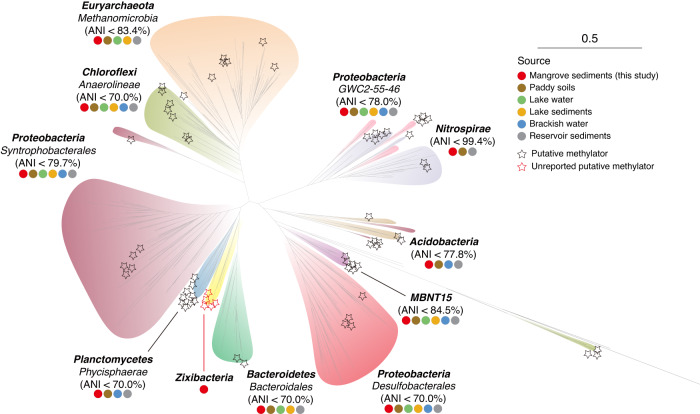
Fig. 3. Maximum-likelihood phylogenetic tree of HgcA protein sequences.
Maximum-likelihood tree (IQ-TREE 2, LG + F + I + I + R9) was constructed using an alignment of HgcA proteins from hgcA-carrying MAGs and Hg-MATE-Db. The representative hgcA sequences recovered in this study are indicated by stars. The Hg-methylating lineages are labeled with colored circles, indicating their distribution in different environments. The scale bar represents one amino acid substitution per sequence position.

