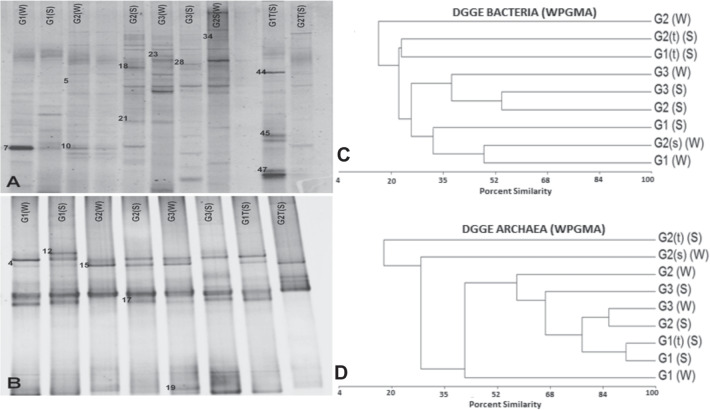
Fig. 2.
DGGE diversity profiles. A PCR-DGGE analysis of the predominant bacterial/archaeal communities of water and sediment samples obtained from the CGF. Total DNA was extracted from samples, and the 16 S rRNA gene was amplified by nested PCR using primers specific for bacteria (A) or archaea (B). Each labeled well represents a separate sample with a denaturing linear gradient from 30 to 60% for bacteria and 20 to 70% for archaea. The bands had been sequenced and compared in the NCBI database, the best results are shown in Table 4. B Numbered bands were submitted for sequencing. UPGMA (unweighted pair-group method using arithmetic averages) dendrogram generated from bacterial denaturing gradient gel electrophoresis (DGGE) profiles. Samples are from water (W), sediment (S), C bacteria, and D archea. G1, G2, and G3 are the hot springs used for sample collection. (W), water sample collected at 1 m of depth; (s) (W), water sample collected at the surface; (S), sediment sample collected at less than 10 cm of depth; (t) (S), sediment sample collected at more than 10 cm of depth

