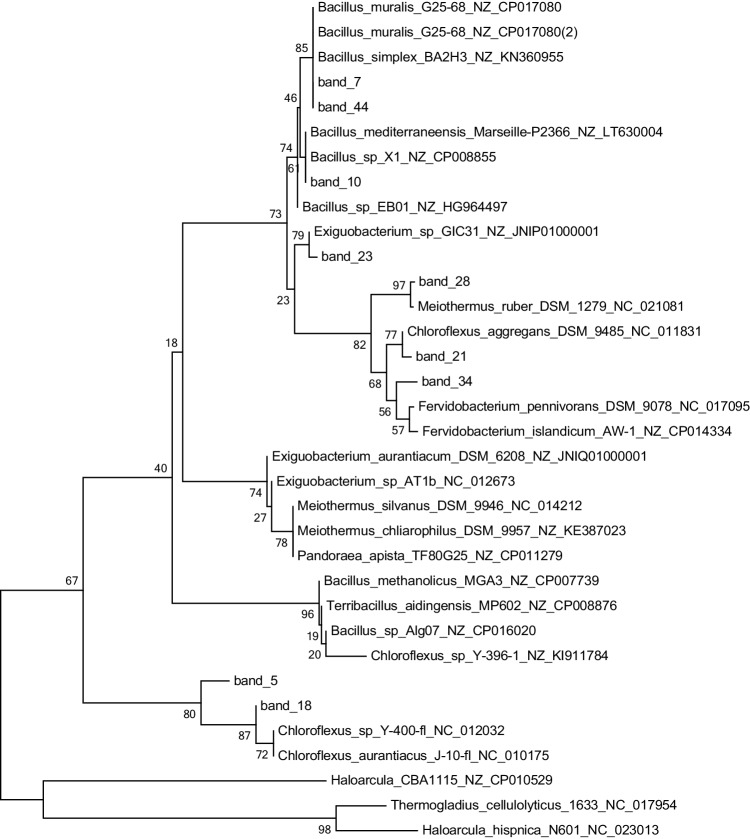
Fig. 3.
Phylogenetic tree of bacterial diversity in the CGF based on partial 16 S rRNA gene sequences. The brightest bands obtained from the DGGE were cut, re-amplified, and sequenced. Sequences were compared with BLASTN to the NCBI database. Sequences from this study are in red, indicating the corresponding DGGE band number. Reference sequences were chosen to represent the greatest diversity of bacteria. Scale bar at the bottom left represents 0.2 (20%) nucleotide sequence difference

