
Fig. 4.
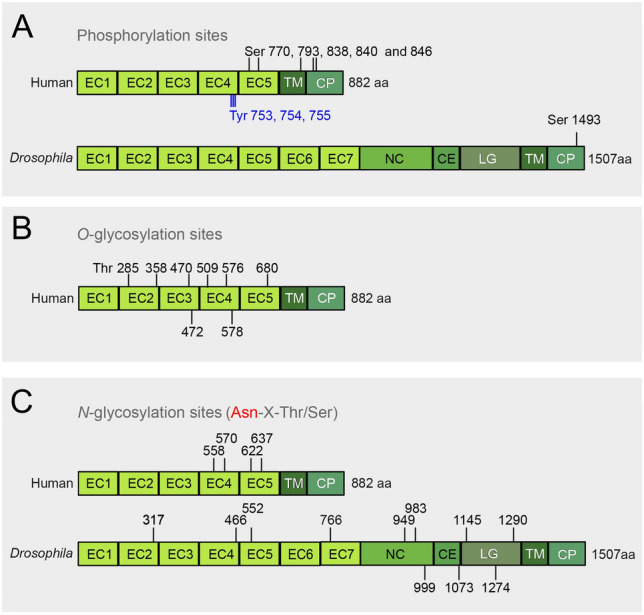
E-cadherin post-translational modifications. A Schematic illustration of E-cadherin phosphorylation sites in humans (Ser 770, 793, 838, 840, and 846, Tyr 753, 754, 755) and Drosophila (Ser 1493). B Schematic representation of E-cadherin O-glycosylation sites in humans (Thr 285, 358, 470, 472, 509, 576, 578, and 680). C Schematic illustration of E-cadherin N-glycosylation sites in humans (Asn 558, 570, 622, and 637) and Drosophila (Asn 317, 466, 552, 766, 949, 983, 999, 1073, 1145, 1274, and 1290)