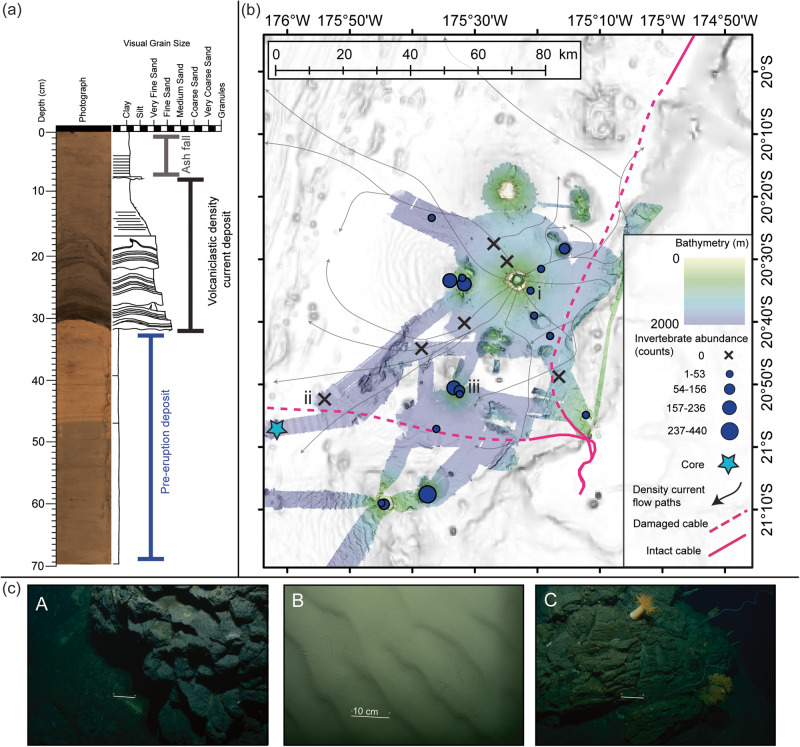
Fig. 3. Relation of density current flow paths to impact on the seafloor including the telecommunications cables, sediment system and invertebrate communities.
a Sediment core log with interpreted pre-eruption, volcaniclastic and ash deposits labelled, from the sediment core indicated with the light blue star in (b). b Compilation map showing seafloor multibeam survey and geologic and biological sampling after the 2022 Hunga Volcano eruption. Indicative density current flow paths taken from modelling results (as in Fig. 2, see Supplemental Movie 1 and Fig. S6) are shown in solid black lines with the arrows indicating directionality of the flow paths interpreted from the modelling simulation. The locations of damaged submarine cable are depicted with dashed pink lines. In order to reach the international cable, the density current must overtop two knolls directly E and ESE of location C, which partially constrains the minimum volume of material in the volcaniclastic density current. The extent of the post-eruption bathymetry survey is shown in colour and was collected by RV Tangaroa and USV Maxlimer. Dark blue graduated points and black crosses show locations where seafloor video footage documented invertebrate abundance (in count) during RV Tangaroa survey in April 2022. c Example images of the seabed across the study area are shown in insets A-C, and each image is located in (b). The white scale bar in each A-C inset is 10 cm, as indicated in the middle inset (B).

