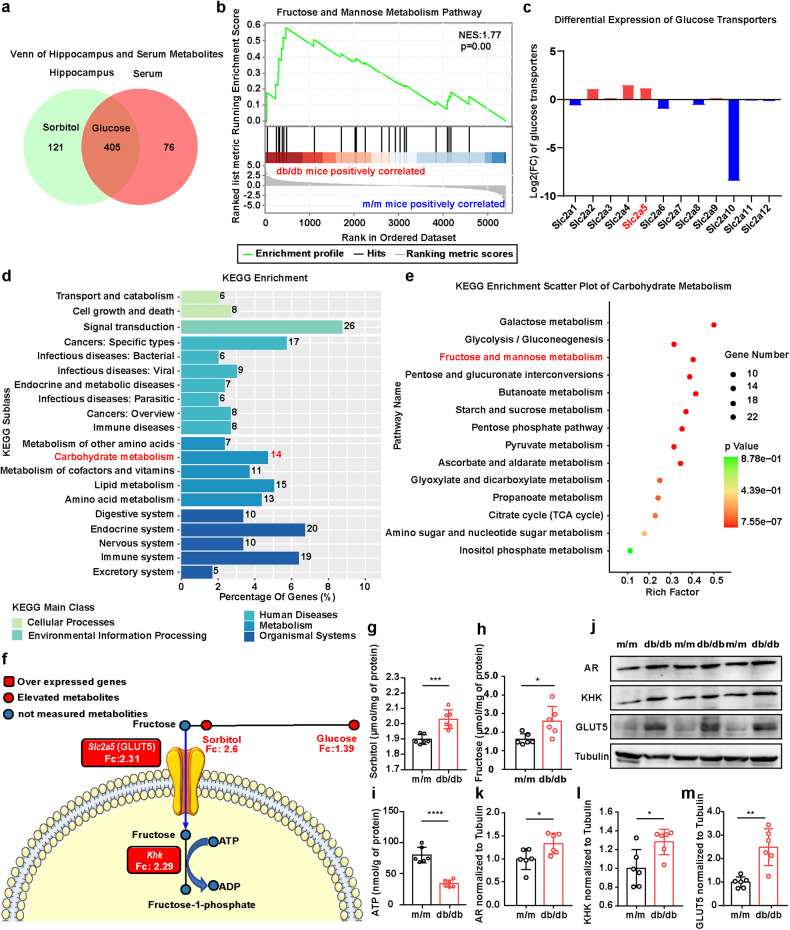
Fig. 1. Alterations in fructose production and metabolism in the hippocampus of diabetic mice.
a Venn diagram of significantly differential metabolites in the serum and hippocampus between db/db and m/m mice (n = 6). b The alteration of the “fructose and mannose metabolism” pathway in the proteomics of db/db vs. m/m mice via GSEA (NES = 1.77, P = 0.0038) (n = 5). c Fold changes of glucose transporters in RNA-seq analysis of db/db vs. m/m mice (n = 5). Red indicates a significant increase in gene expression levels, while blue indicates significantly lower gene expression levels. d KEGG enrichment of DEGs related to significantly differential metabolites (P < 0.05) (n = 5). e Fourteen KEGG pathways involved in the classification of carbohydrate metabolism. f Based on the data from omics above, schematic representation of core metabolic and transcriptional relevant differences in the pathway of “fructose and mannose metabolism”. The circles present metabolites, and the rectangles present genes. Red indicates a significant increase in metabolite concentrations or gene expression levels, while blue indicates no detection. g–i The concentrations of sorbitol (g), fructose (h) and ATP (i) in the hippocampus of db/db and m/m mice (n = 6). j–m Representative western blot (j) and densitometric analysis of AR (k), GLUT5 (l) and KHK (m) (n = 6). The data are presented as the mean ± SEM and were analyzed by Student’s t test (g–i, k–m). *P < 0.05; **P < 0.01; ***P < 0.001; ****P < 0.0001.

