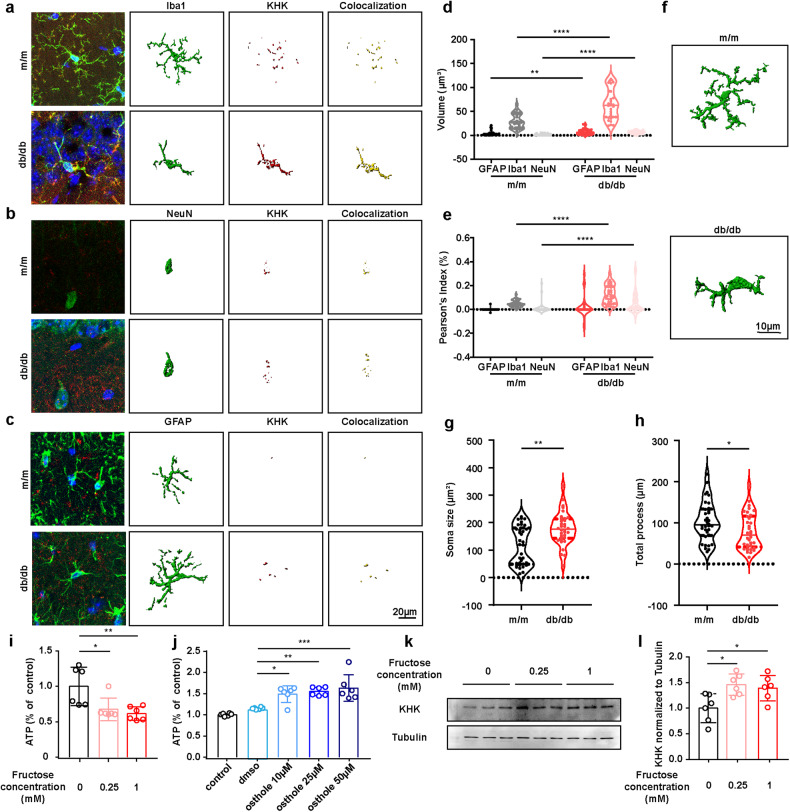
Fig. 2. The central role of microglia in fructose metabolism in the hippocampus of db/db mice.
a–c Representative confocal images and three-dimensional reconstruction by Imaris software illustrated the colocalization status of KHK (red) in microglia (a, green), neurons (b, green) or astrocytes (c, green). DNA was labeled by DAPI (blue). Scale bar = 20 μm. d Volume of KHK and cell marker colocalization intensity from (a–c) (n = 30 from 4-5 mice). e Correlation of KHK with different cell markers based on fluorescence intensity (n = 30 from 4-5 mice). f Representative Imaris-based three-dimensional reconstruction of hippocampal microglia from db/db and m/m mice. Scale bar = 10 μm. g, h Quantification of microglial soma size (g) and total processes (h) (n = 34 microglia from 4-5 mice). i The alteration of ATP levels in microglia treated with increasing fructose doses (n = 6). j Osthole increased ATP levels in microglia treated with 0.25 mM fructose (n = 6). k, l Representative western blot (k) and densitometric analysis (l) of KHK (n = 6). The data are presented as the mean ± SEM. The data in (d, e) were analyzed by Student’s t test or the Mann‒Whitney test based on the results of the normal distribution test. The data in (g) were analyzed by the Mann‒Whitney test. The data in (h) were analyzed by Student’s t test. The data in (i, j, l) were analyzed by one-way ANOVA with Tukey’s post hoc analysis. *P < 0.05; **P < 0.01; ***P < 0.001; ****P < 0.0001.

