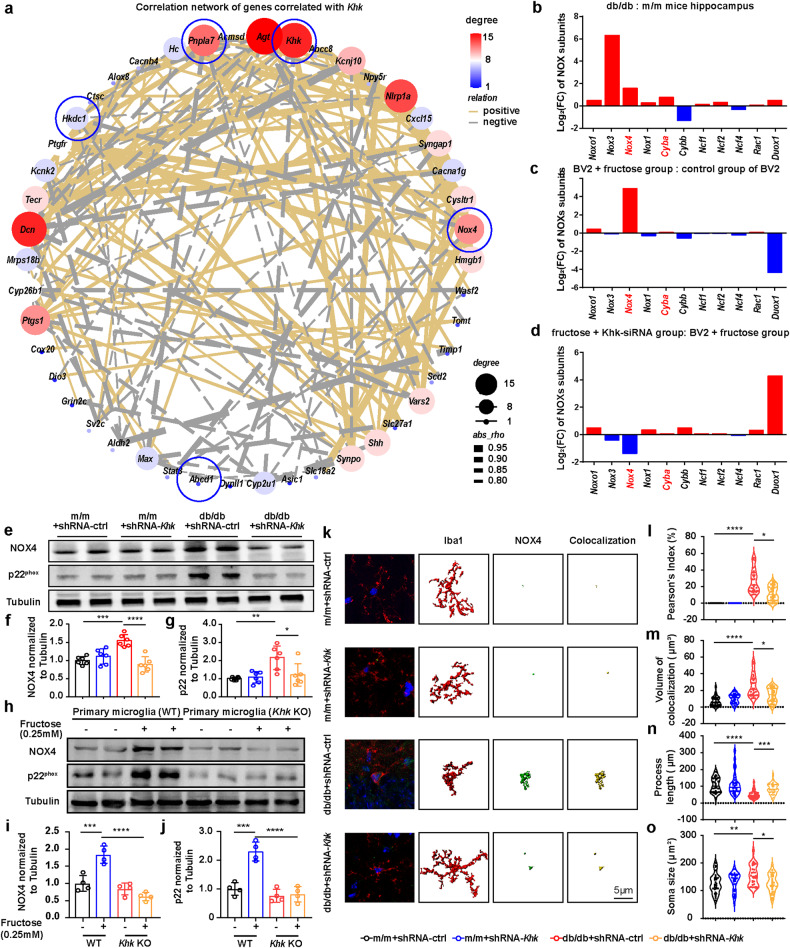
Fig. 3. Effects of Khk knockdown on NOX4 expression and ROS production.
a Correlation networks of genes correlated with Khk in hippocampal RNA-seq analysis based on the |correlation coefficient |> 0.8. b Fold changes in Nox subunits from RNA-seq analysis of the hippocampus (db/db vs. m/m mice) (n = 5). c, d Fold changes in Nox subunits from RNA-seq analysis in the BV2 cell line between different conditions (n = 6). e–g Representative western blot (e) and densitometric analysis of NOX4 (f) and p22phox (g) in the hippocampus (n = 6). h–j Representative western blot (h) and densitometric analysis of NOX4 (i) and p22phox (j) in WT or Khk KO primary microglia with or without fructose treatment (n = 4). k Representative confocal images and three-dimensional reconstruction of NOX4 (green) in microglia (red) (n = 30). DNA was labeled by DAPI (blue). Scale bar = 5 μm. l Correlation of NOX4 and Iba1 fluorescence intensity (n = 30 from 4-5 mice). m Volume of NOX4 and Iba1 colocalization (n = 30 from 4-5 mice). n, o Quantification of microglial total processes (n) and soma size (o) (n = 30 from 4-5 mice). The data are presented as the mean ± SEM and were analyzed by one-way ANOVA with Tukey post hoc analysis (f, g, i, j) or by Kruskal‒Wallis followed by Dunn’s multiple comparisons tests (l–o). *P < 0.05; **P < 0.01; ***P < 0.001; ****P < 0.0001.

