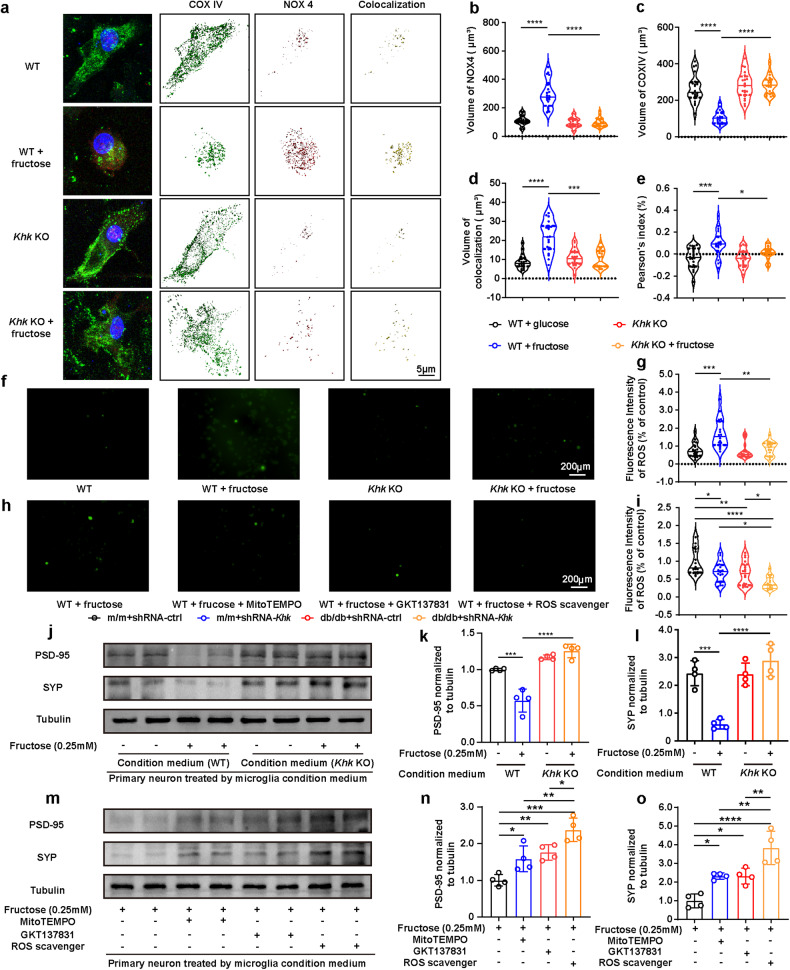
Fig. 5. Fructose metabolism in microglia mediates spine elimination via NOX4 mitochondrial translocation and ROS generation.
a Representative immunofluorescence image and three-dimensional reconstruction of the mitochondrial markers COX IV (green) and NOX4 (red) in WT or Khk KO primary microglia treated with or without fructose. DNA was labeled by DAPI (blue). Bar = 5 μm. b–d Fluorescence intensity of NOX4 (b), COX IV (c) and their colocalization (d) (n = 20 cells from 3 independent experiments). e Correlation of NOX4 and COX IV fluorescence intensity (n = 20 cells from 3 independent experiments). f, g Representative fluorescence images (f) and quantification analysis (g) of ROS fluorescence intensity in primary microglia treated with or without fructose (n = 18 from 3 independent experiments). Scale bar = 200 μm. h, i Representative fluorescence images (h) and quantification analysis (i) of ROS fluorescence intensity of primary microglia treated with or without NOX4 inhibitor (GKT137831), mitochondrial ROS inhibitor (Mito-Tempo) or ROS scavenger (N-acetylcysteine) in fructose-loaded medium (n = 18 from 3 independent experiments). Scale bar = 200 μm. j–l WT or Khk KO primary microglia were treated with or without fructose, and then the primary microglia-conditioned medium was collected for primary neuron culture. Representative western blot (j) and densitometric analysis of PSD-95 (k) and SYP (l) in primary neurons (n = 4). m–o WT primary microglia were treated with or without MitoTEMPO, GKT137831, and ROS scavengers in fructose-loaded medium, and the primary microglia-conditioned medium was collected for primary neuron culture. Representative western blot (m) and densitometric analysis of PSD-95 (n) and SYP (o) expression in primary neurons (n = 4). The data are presented as the mean ± SEM and were analyzed by one-way ANOVA with Tukey post hoc analysis (c, e, g, k, l, n, o) or Kruskal‒Wallis followed by Dunn’s multiple comparisons tests (b, d, i). *P < 0.05; **P < 0.01; ***P < 0.001; ****P < 0.0001.

