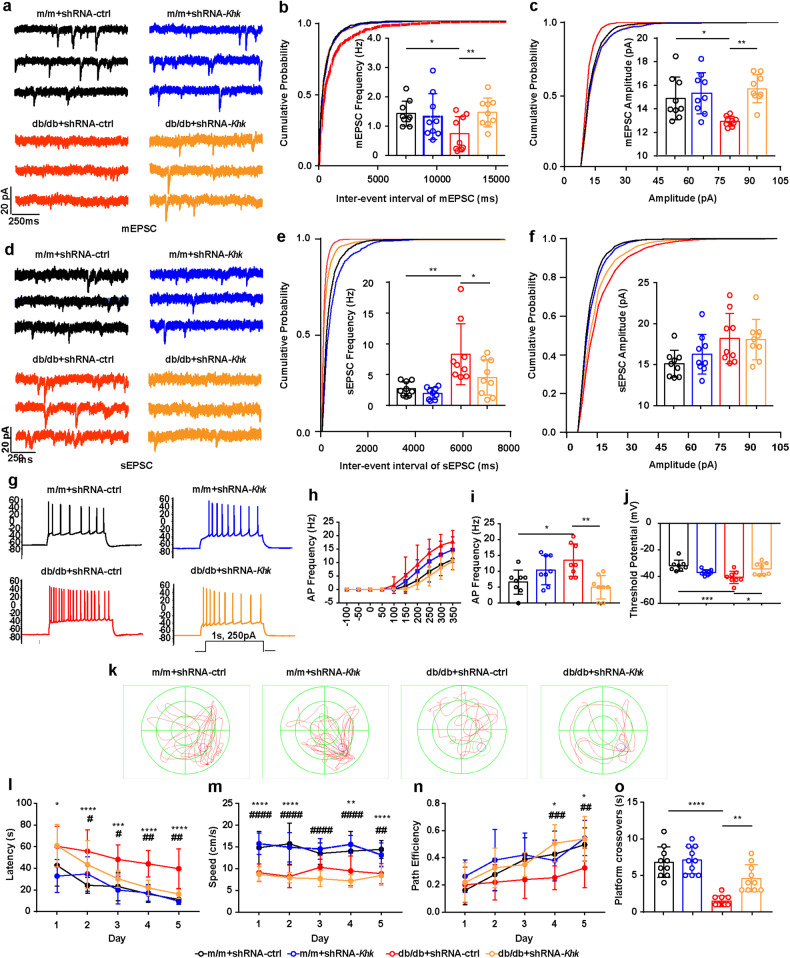
Fig. 7. Effects of Khk knockdown on synaptic transmission.
a–c Representative trace of mEPSCs (a) and quantification analysis of frequency (b) and amplitude (c) alterations in mEPSCs. (n = 9). d–f Representative trace of sEPSCs (d) and quantification analysis for frequency (e) and amplitude (f) alternations of sEPSCs (n = 9). g, h Representative trace of action potentials (APs) (g) and their frequency (h) in different groups. i, j Quantitative analysis of AP frequency (i) and threshold potential (j) (n = 8). k–o Representative traces from the Morris water maze (MWM) test (k) and the quantification of latency (l), swimming speed (m), path efficiency (n), and platform crossovers (o) (n = 10). The data are presented as the mean ± SEM. The data in (b, c, e, f, i, j, o) were analyzed by one-way ANOVA with Tukey’s post hoc analysis. The data in (l–n) were analyzed by two-way ANOVA. *P < 0.05 versus the m/m + shRNA-ctrl group, #P < 0.05 versus the db/db + shRNA-ctrl group; **P or ##P < 0.01; ***P or ###P < 0.001; ****P or ####P < 0.0001.

