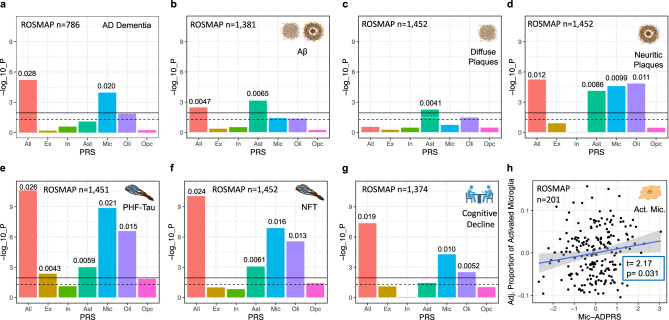
Fig. 2. Association of cell-type-specific AD polygenic risk scores in ROSMAP.
a Association of cell-type-specific ADPRSs with the odds of AD with dementia (case: n = 538, control: n = 248). b Association of cell-type-specific ADPRSs with overall Aβ burden. c Association of cell-type-specific ADPRSs with overall diffuse plaque (DP) burden. d Association of cell-type-specific ADPRSs with overall neuritic plaque (NP) burden. e Association of cell-type-specific ADPRSs with overall paired-helical-filament tau (PHFtau) burden. f Association of cell-type-specific ADPRSs with overall neurofibrillary tangle (NFT) burden. g Association of cell-type-specific ADPRSs with cognitive decline (the slope of annual change in antemortem measures of global cognitive composite). For a–g, the y-axis indicates -log10(p-value) of each association, the black solid horizontal line indicates the p-value corresponding to multiple comparisons-corrected statistical significance (FDR = 0.025), and the black dashed horizontal line indicates p = 0.05. The p-values (two-sided, unadjusted) are from regression models (a logistic regression, b–g linear regression) adjusting for APOE ε4, APOE ε2, age at death, sex, genotyping platform, years of education (only for a and g), and the first three genotyping principal components. The effect size of each statistically significant PRS-trait association was quantified with ΔR2 (difference of Nagelkerke’s R2 (a) or adjusted R2 (b–g) between the linear models with and without the given PRS term; b–g) and indicated above the bar graph. Also, see Supplementary Tables 3–9 for further details. Source data are provided as a Source Data file. h Association of Mic-ADPRS (x-axis) and the proportion of activated microglia (PAM, y-axis). On y-axis, residual PAM values adjusting for covariates (APOE ε4, APOE ε2, age at death, sex, genotyping platform, and the first three genotyping principal components) were shown. T-statistics and p-values from linear regression (adjusting for the covariates) are shown. Created with Biorender.com. Act. Mic. activated microglia, All full autosomal genome, Ast astrocytes, Ex excitatory neurons, In inhibitory neurons, Mic microglia, Oli oligodendrocytes, Opc oligodendroglial progenitor cells.

