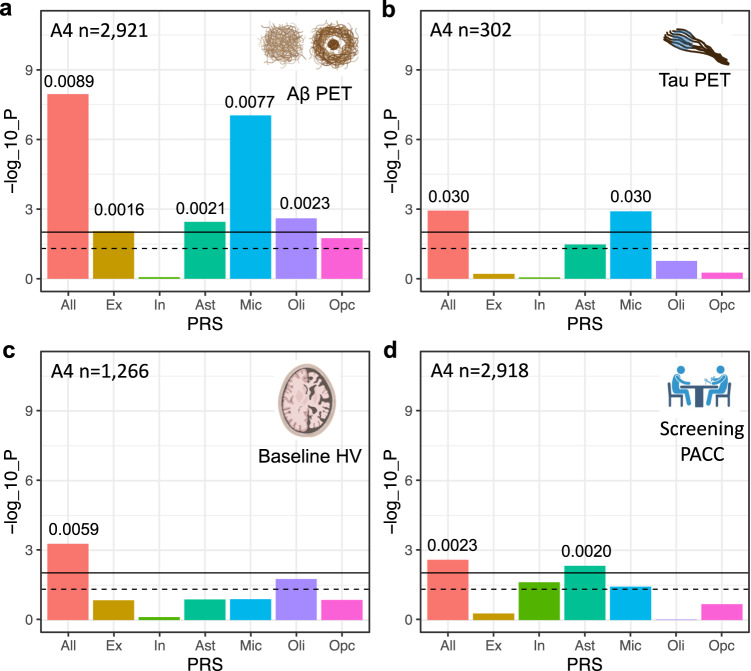
Fig. 4. Association of cell-type-specific AD polygenic risk scores in A4.
a Association of cell-type-specific ADPRSs with cortical Aβ (florbetapir PET cortical composite SUVR). b Association of cell-type-specific ADPRSs with temporal lobe tau (flortaucipir PET temporal lobe composite SUVR). c Association of cell-type-specific ADPRSs with hippocampal volume (HV). d Association of cell-type-specific ADPRSs with screening Preclinical Alzheimer Cognitive Composite (PACC). The y-axis indicates -log10(p-value) of each association. The black solid horizontal line indicates the p-value corresponding to statistical significance (FDR = 0.025), and the black dashed horizontal line indicates p = 0.05. The p-values (two-sided, unadjusted) are from linear regression models adjusting for APOE ε4, APOE ε2, age, sex, intracranial volume (only for c), years of education (only for d), and the first three genotyping principal components. Effect size of each statistically significant PRS-trait association was quantified with ΔR2 (difference of adjusted R2 between the linear models with and without the given PRS term) and indicated above the bar graph. Also, see Supplementary Tables 18, 22, 25, and 26 for further details. Source data are provided as a Source Data file. Created with Biorender.com. SUVR standardized uptake value ratio.

