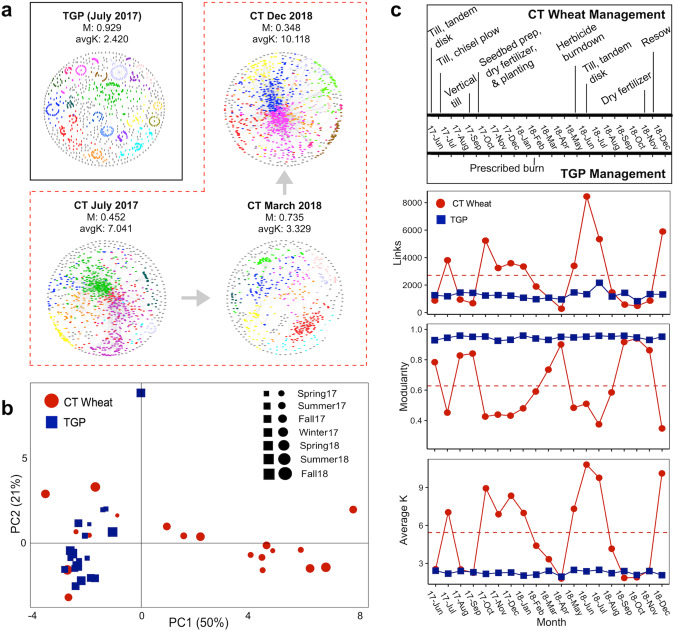
Fig. 1. Temporal dynamics of soil microbial networks.
a Visualization of soil microbial networks. Difference of molecular ecological networks (MENs) due to land conversion represented by single tallgrass prairie (TGP) MEN since was relatively stable over sampling time. The other networks depict temporal differences of MENs for the conventional till (CT) wheat land use. Large modules with ≥10 node are shown in different colors, and smaller modules are shown in gray. Colors are not conserved between networks. Visual representations of all CT networks are found in Fig. S1. b Twenty-two network topological parameters were used for principal component analysis (PCA) to show differences in overall network properties over 19-month sampling period. Sampling times groups by season. c Temporal changes of select network topological parameters, including links, average K, and Modularity. Red circles represent networks under CT wheat land use and blue squares represent native TGP (control) land use. The dashed red line represents the mean of the properties for CT wheat land use.

