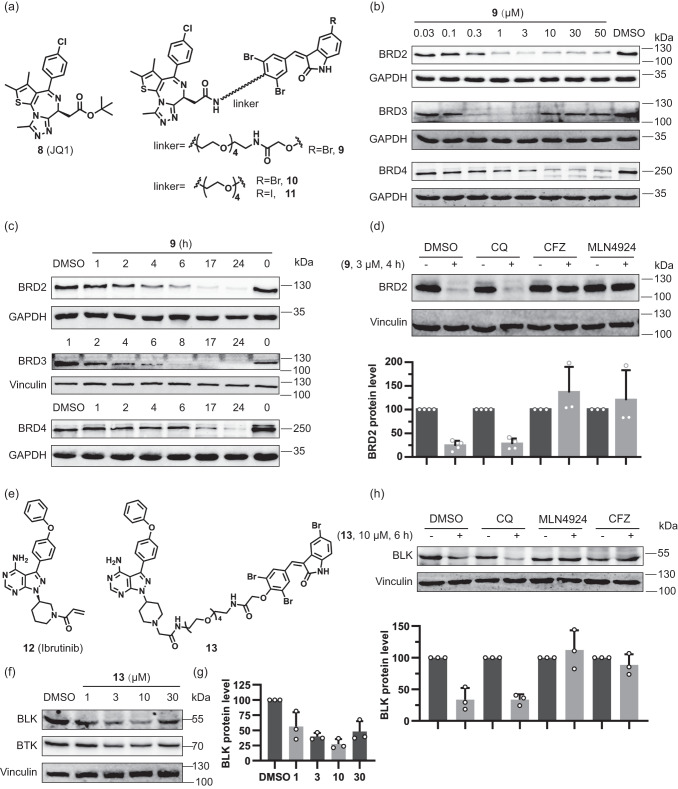
Fig. 2. Degradation activity and mechanism of action of bifunctional compounds that target BET proteins or BTK/BLK.
a Structures of the BET inhibitor JQ1 and selected bifunctional degraders. b Dose-dependent degradation of BET proteins in Jurkat cells treated with compound 9 for 6 h. Representative result of n = 3 is shown. c Time-dependent degradation of BET proteins in Jurkat cells treated with compound 9 at 3 μM. Representative result of n = 3. d BRD2 protein levels in Jurkat cells pretreated with the autophagy inhibitor CQ (50 μM), proteasome inhibitor CFZ (1 μM) and neddylation inhibitor MLN4924 (1 μM) for 40 min, followed by treatment with 3 µM compound 9 for another 4 h. Quantification of the relative BRD2 protein content in relation to the DMSO control is shown in the bar graph. Data are mean values ± SD (n = 4 biological replicates for DMSO and CQ; n = 3 biological replicates for MLN4924 and CFZ). e Structures of the BTK- and BLK inhibitor ibrutinib and related bifunctional degrader. f Dose-dependent degradation of BTK- and BLK proteins in Jurkat cells treated with compound 13 for 6 h. Representative result of n = 3 is shown. g Quantification of the relative BLK protein content, which was normalized to the DMSO control. Data are mean values ± SD (n = 3 biological replicates). h BLK protein levels in Ramos cells pretreated with the autophagy inhibitor CQ (50 μM), proteasome inhibitor CFZ (1 μM) and neddylation inhibitor MLN4924 (1 μM) for 40 min, followed by treatment with 10 µM of compound 13 for another 6 h. Quantification of the relative BLK protein content in relation to the DMSO control is shown in the bar graph. Data are mean values ± SD (n = 3 biological replicates).

