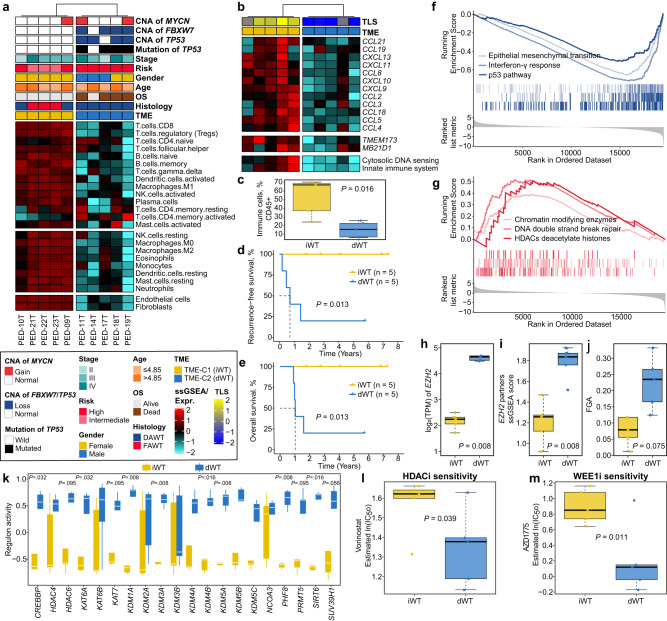
Fig. 2. Association between desert-like Wilms tumors (WTs) and TP53 mutation in diffuse anaplastic WT.
a Heatmap showing two tumor microenvironment (TME) phenotypes using curated signatures of 24 microenvironment cell types. Clinicopathological information and genetic alteration were annotated at the top panel. DAWT, diffuse anaplastic Wilms tumor; FAWT, focal anaplastic Wilms tumor; ssGSEA, single-sample gene set enrichment analysis. b Heatmap showing different expression patterns of genes of interest. c Boxplot showing the distribution of bulk immune cell proportions between iWT (n = 5) and dWT (n = 5) using deconvolution approach with two-sided Mann-Whitney test. d Kaplan-Meier curve of recurrence-free survival (RFS) rate with two-sided log-rank test between two TME phenotypes (n = 10). e Kaplan-Meier curve of overall survival (OS) rate with two-sided log-rank test between two TME phenotypes (n = 10). GSEA curves showing significantly f downregulated and g upregulated pathways in dWT versus iWT. Boxplot showing expression of h EZH2, i enrichment score of EZH2 partners, j fraction of genome altered (FGA), k chromatin remodeling regulons activity using two-sided Mann-Whitney test, and estimated drug sensitivity of l HDAC inhibitor and m WEE1 inhibitor between dWT (n = 5) and iWT (n = 5) using one-sided Student’s t-test. For all boxplots, the center line represents the median, box hinges represent first and third quartiles and whiskers represent ± 1.5× interquartile range. Source data are provided as a Source Data file.

