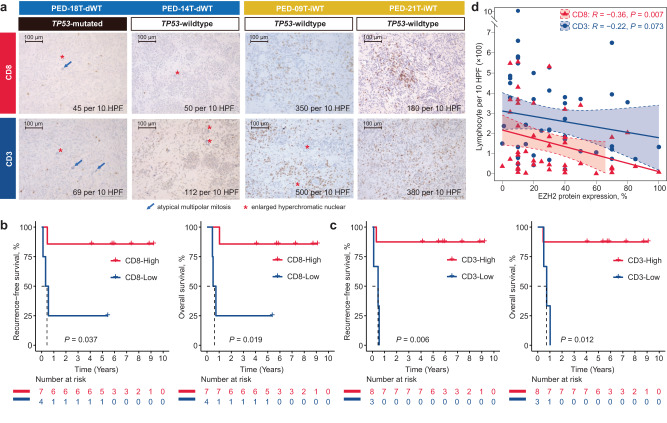
Fig. 3. Prognostic value of tumor-infiltrating lymphocytes in pretreated anaplastic Wilms tumors (WTs).
a Immunohistochemistry images of CD8 and CD3 in different tumor microenvironment (TME) subtypes of WT, including two samples for iWT (PED-18T and PED-14T) and two samples for dWT (PED-09T and PED-21T). Immunostaining using anti-CD3 and anti-CD8 antibodies was performed using standard protocol. Results on these tumors are shown at magnification x200 (scale bar 100 μm), with marked hallmark of anaplasia. Positive CD3 and CD8 lymphocytes were counted on 10 field at high-power fields (HPF, x400). b Kaplan-Meier curves of recurrence-free survival (RFS) (left panel) and overall survival (OS) (right panel) with two-sided log-rank test regarding the count of CD8 in anaplastic WTs (n = 11). c Kaplan-Meier curves of RFS (left panel) and OS (right panel) with two-sided log-rank test regarding the count of CD3 in anaplastic WTs (n = 11). d Scatter plot showing one-sided Spearman’s correlation between the percentage of EZH2 protein expression and count of CD3+ and CD8+ cells. Data are presented as linear model fits, with shaded areas representing the 95% confidence interval. Source data are provided as a Source Data file.

