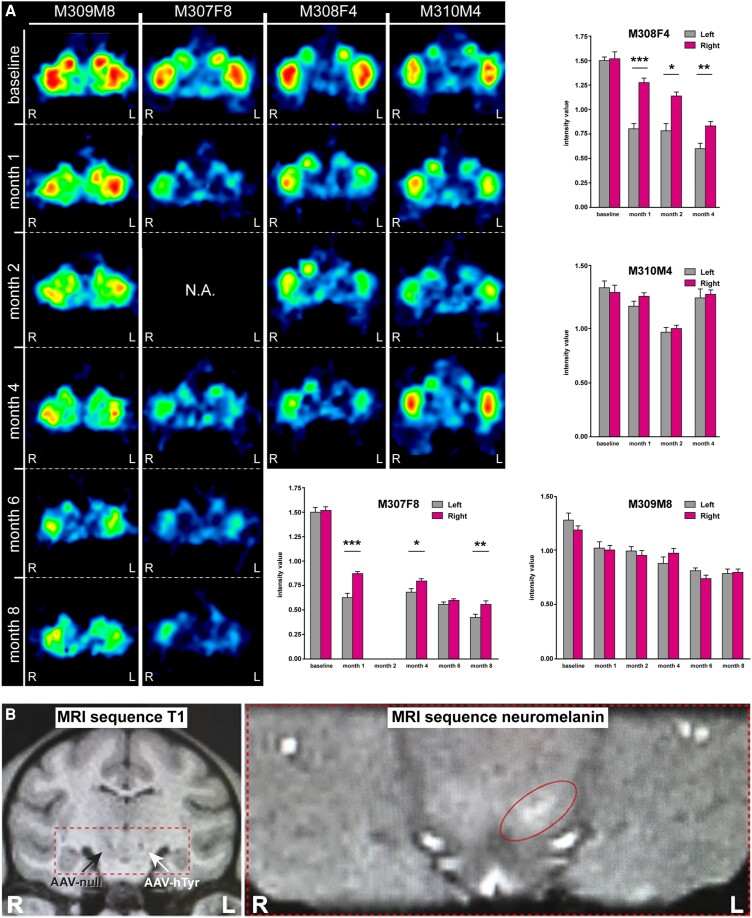
Figure 2.
Neuroimaging studies. (A) MicroPET studies. Representative coronal sections of the non-human primate (NHP) brain at the level of the putamen nucleus showing the binding potential of 11C-DTBZ (a selective VMAT2 ligand). Histograms illustrate the obtained measurements by comparing radiotracer uptake in left versus right hemispheres at each pre-defined time point. Statistical differences were more often found in female animals. *P < 0.05, **P < 0.01, ***P < 0.001, related samples t-test, n = 10 sections/animal. Data are presented as mean ± standard deviation (SD). (B) MRI scans. Left: Anatomical T1-weighted coronal MRI scan taken at the level of the ventral mesencephalon showing the location of the injection sites for AAV-hTyr (left SNpc) and the control AAV-null (right SNpc). Right: Hyperintense area in the left SNpc as observed with a neuromelanin-dedicated sequence. SNpc = substantia nigra pars compacta.

