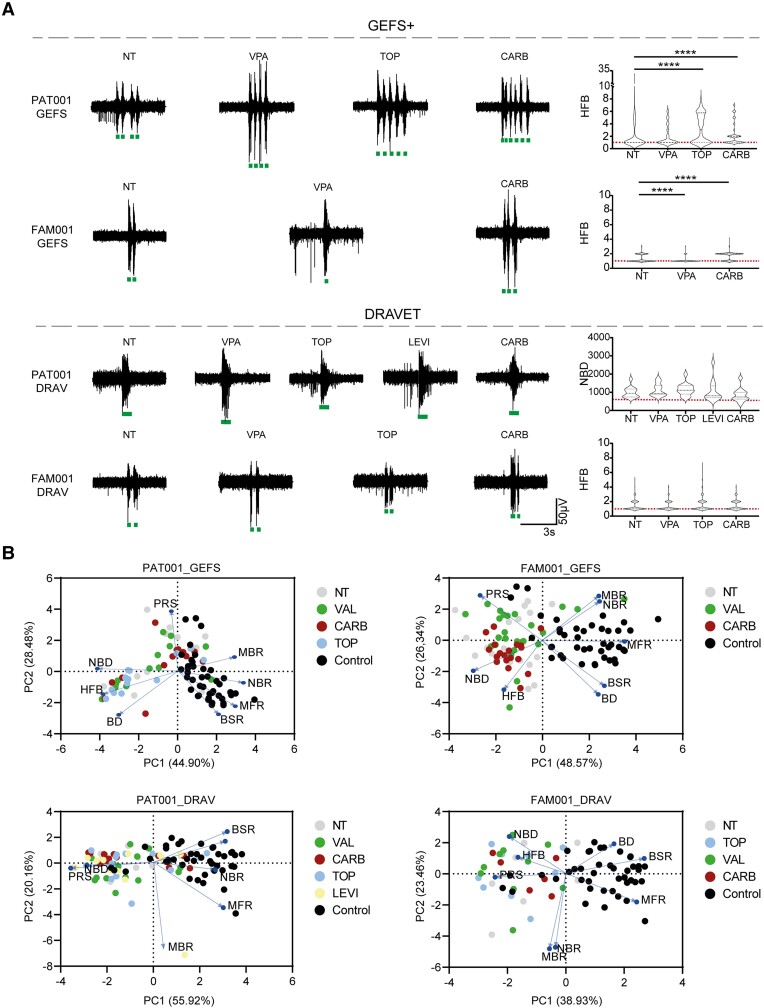
Figure 5.
GEFS+, but not Dravet syndrome-derived neuronal networks, respond to anti-seizure medication. (A) Representative burst traces of GEFS+ patients (top) and Dravet syndrome (DS) patients (bottom), including quantification of number of high frequency bursts (HFB) for PAT001_GEFS, FAM001_GEFS and FAM001_DRAV lines, and network burst duration (NBD) for PAT001_DRAV in non-treated (NT) patients or those treated with 10 µM topiramate (TOP), valproic acid (VPA), levetiracetam (LEVI) or carbamazepine (CARB). HFB quantification for PAT001_DRAV was not included, since this line does not show HFB. Dashed line represents median, dotted line represents quartiles. Red dashed line represents control median. (B) Principal component analysis (PCA) plot of eight multi-electrode array (MEA) parameters, including mean firing rate (MFR), mean burst rate (MBR), network burst rate (NBR), percentage of random spikes (PRS), burst duration (BD), NBD, burst spike rate (BSR) and HFB, showing parameters that explain the differences in network behaviour between control and patient lines, in either non-treated patients or those treated with anti-seizure medication. Blue arrows indicate loadings. For all MEA data, n = number of wells/independent differentiations: PAT001_GEFSNTn = 13/5, PAT001_GEFSVALn = 13/5, PAT001_GEFSTOPn = 13/5, PAT001_GEFSCARBn = 13/5, PAT001_DRAVNTn = 13/5, PAT001_DRAVVALn = 15/5, PAT001_DRAVTOPn = 14/6, PAT001_DRAVLEVIn = 12/5, PAT001_DRAVCARBn = 13/4, FAM001_GEFSNTn = 18/6, FAM001_GEFSVALn = 24/6, FAM001_GEFSCARBn = 19/4, FAM001_DRAVNTn = 7/3, FAM001_DRAVTOPn = 9/3, FAM001_DRAVVALn = 10/3 FAM001_DRAVCARBn = 6/1. Significance calculated using ANOVA with Kruskal–Wallis test and Dunn’s correction for multiple comparisons. *P = 0.05, **P = 0.01, ***P = 0.001, ****P < 0.0001. All means, SEM and P-values of significant differences are listed in Supplementary Table 1.

