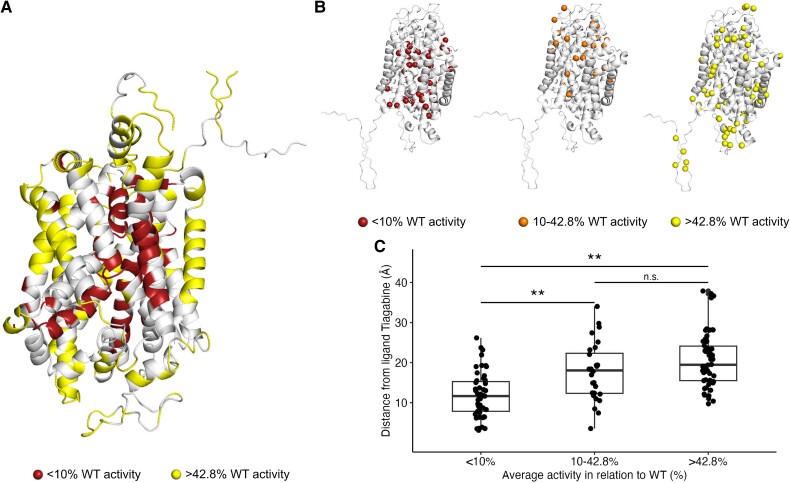
Figure 3.
The spatial relation of SLC6A1 variants is associated with function and position within the GAT1 protein structure 3D structure (PDB id: 7SK2). 23 (A) GAT1 3D structure colour-coded in red regions with nearly complete loss-of-function (LoF) variants (<10% of normalized wild-type activity) and in yellow regions with wild-type activity variants (>42.8% of normalized wild-type activity). (B) Side view of the GAT1 3D structure. SLC6A1 variants were categorized in the same three activity groups [0–10% (left), 10–42.8% (middle), > 42.8% (right)] and mapped onto the GAT1 3D structure. The variants with the lowest and medium average functional activity tend to be closer to the ligand, whereas variants with wild-type activity tend to face outwards. (C) Box plot showing the quantification of each variant’s distance (Å) from the ligand by the three activity groups. **Significant after Bonferroni multiple test correction; *Nominally significant; n.s. = not significant; WT = wild-type.

