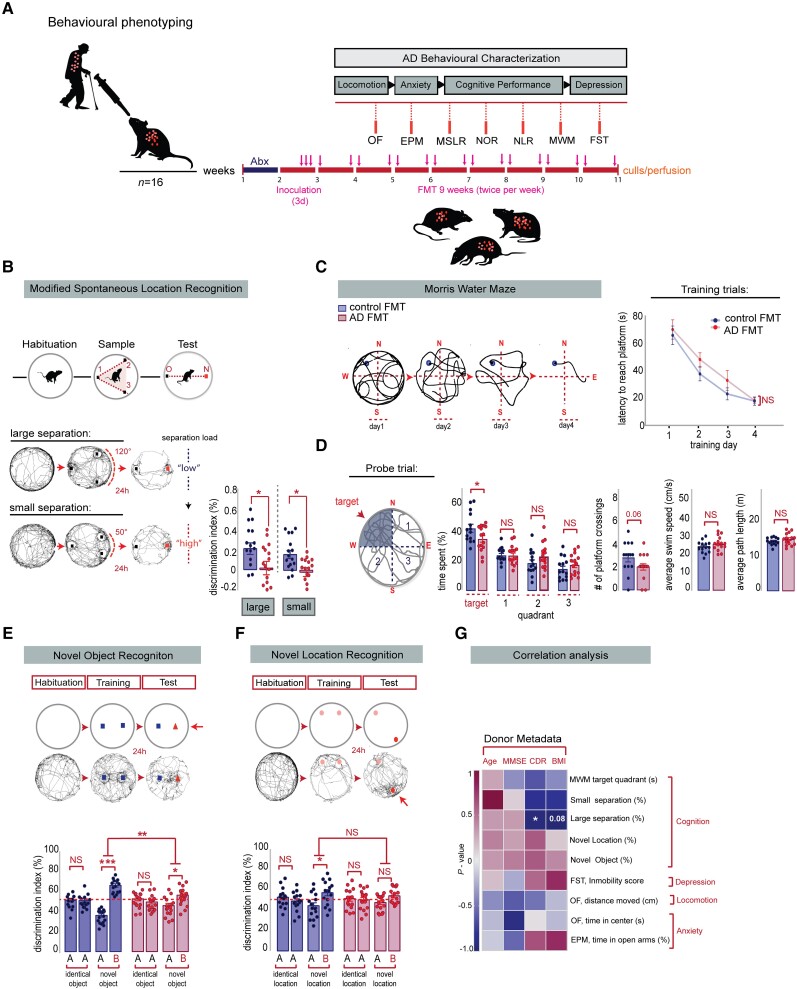
Figure 3.
Alzheimer’s-FMT induced cognitive deficits in hippocampal-neurogenesis dependent behaviours in young adult rats. (A) Overview of the Alzheimer’s-related behaviours. Vertical bars represent weekly intervals. Behaviours include: Open Field (OF), Elevated Plus Maze (EPM), Modified Spontaneous Location Recognition (MSLR), Novel Object Recognition (NOR), Novel Location Recognition (NLR), Morris Water Maze (MWM) and Forced Swim test (FST). (B) Top: Illustration of the MSLR task. Bottom: Alzheimer’s-FMT rats displayed a significant reduction in the discrimination index in the large separation task, two-tailed Student’s t-test, *P = 0.0353 and small separation task, Mann-Whitney U-test, *P = 0.0108. (C) Left: Representative tracings in platform trials in the MWM. Right: Escape latency during platform trials in MWM. No significant differences in learning were detected during the acquisition training days in the MWM test, two-way mixed ANOVA, effect of FMT: P = 0.2148, effect of time: ***P < 0.0001, FMT × Time interaction: P = 0.6672. (D) When challenged in the probe trial, Alzheimer’s-FMT rats spent significantly less time in the target quadrant, unpaired, two-tailed Student’s t-test, *P = 0.0498. Average number of platform crossings was reduced in Alzheimer’s-FMT rats compared to control FMT rats, Mann-Whitney test, P = 0.0670. Alzheimer’s-FMT colonized rats displayed no significant change in the locomotory parameters of the probe trial, as determined by average swim speed, unpaired, two-tailed Student’s t-test, P = 0.1582 and path length, unpaired, two-tailed Student’s t-test, P = 0.2246. (E) Top: Illustration of the NOR test. Bottom: In the training session, no significant difference was detected between the differentiation index of the two identical objects in the control FMT rats, two tailed paired Student’s t-test, P = 0.9859 and Alzheimer’s-FMT rats, P = 0.4149. In the test session, Alzheimer’s-FMT rats show a significant reduction in the discrimination index of the novel objects compared to control FMT rats, unpaired, two-tailed Student’s t-test, **P = 0.0019. (F) Top: Illustration of the NOL test. Bottom: In the training sessions, no significant difference was detected between the differentiation index of the two identical locations in the control FMT rats, two tailed paired Student’s t-test, P = 0.4244 and Alzheimer’s-FMT rats, P = 0.8267. In the test session, Alzheimer’s-FMT rats show no significant reduction in the discrimination index of the novel location compared to control FMT rats, unpaired, two-tailed Student’s t-test, P = 0.4032. (G) Spearman’s rank and Pearson correlation between rat behaviour and human donor metadata. Heat map showing Spearman p (rho) or Pearsons R correlation coefficients, with red indicating strong positive correlation, and blue indicating strong negative correlation. P-values for significant correlations (α<0.05) are noted. All data are presented as mean ± SEM, *P < 0.05, **P < 0.01, ***P < 0.001. AD = Alzheimer’s disease; BMI = body mass index; CDR = Clinical Dementia Rating; FMT= faecal microbiota transplantation; MMSE = Mini-Mental State Examination; NS = not significant.

