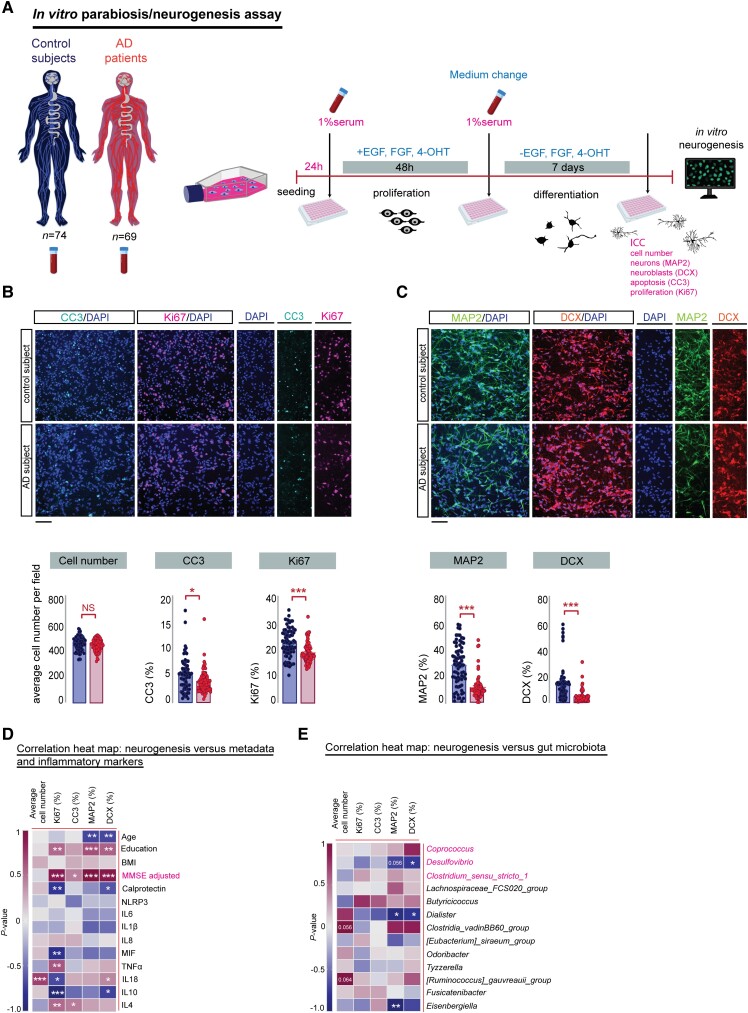
Figure 5.
Serum from Alzheimer’s patients decreased neurogenesis in human hippocampal progenitor cells. (A) Experimental timeline of the in vitro parabiosis/neurogenesis assay: human hippocampal progenitor cells (HPCs) were cultured with 1% human serum from age-matched cognitively healthy and Alzheimer’s patients. Cellular readouts are expressed as percentage relative to neural cell number. Fifteen fields were analysed per well, n = 3 biological replicates. (B) Top: Representative confocal micrographs showing CC3-positive HPCs cells (green: CC3-positive cells, blue: DAPI) and Ki67-positive HPCs cells (red: DCX-positive cells, blue: DAPI) during the differentiation phase of the assay. Scale bar = 100 μm. Bottom: No significant change was detected in the average number of HPCs per field between control and Alzheimer’s patients during the differentiation phase of the human serum assay, unpaired, two-tailed Student’s t-test, P = 0.1855. Staining for the apoptotic marker CC3 revealed a significant decrease in cell death in HPCs cells receiving serum from Alzheimer’s patients compared to controls, Mann-Whitney test, *P = 0.0100. Serum from Alzheimer’s patients induced a significant reduction in the expression level of the proliferation cell marker Ki67, Mann-Whitney test, ***P < 0.0001. (C) Top: Immunofluorescence staining of MAP2-positive HPCs cells (green: MAP2-positive cells, blue: DAPI) and DCX-positive HPCs cells (red: DCX-positive cells, blue: DAPI) during the differentiation phase of the assay. Scale bar = 100 μm. Bottom: Serum from Alzheimer’s patients caused a significant reduction in the expression levels of neurons (MAP2), Mann-Whitney test, ***P < 0.0001 and neuroblasts (DCX), Mann-Whitney test, ***P < 0.0001. (D) Spearman’s rank correlation between in vitro cellular neurogenesis readouts, human donor metadata and serum inflammatory markers. Correlation heat maps showing Spearman’s rank coefficients, with red indicating strong positive correlation and blue indicating strong negative correlation. (E) Spearman correlation between in vitro cellular neurogenesis readouts and human donor gut microbiota. P-values for significant correlations (α < 0.05) are noted. Control serum n = 74, Alzheimer’s serum n = 69. All data are presented as mean ± SEM. Panel (A) was created with BioRender.com. *P < 0.05, **P < 0.01, ***P < 0.001. AD = Alzheimer’s disease; ICC = immunocytochemistry.

