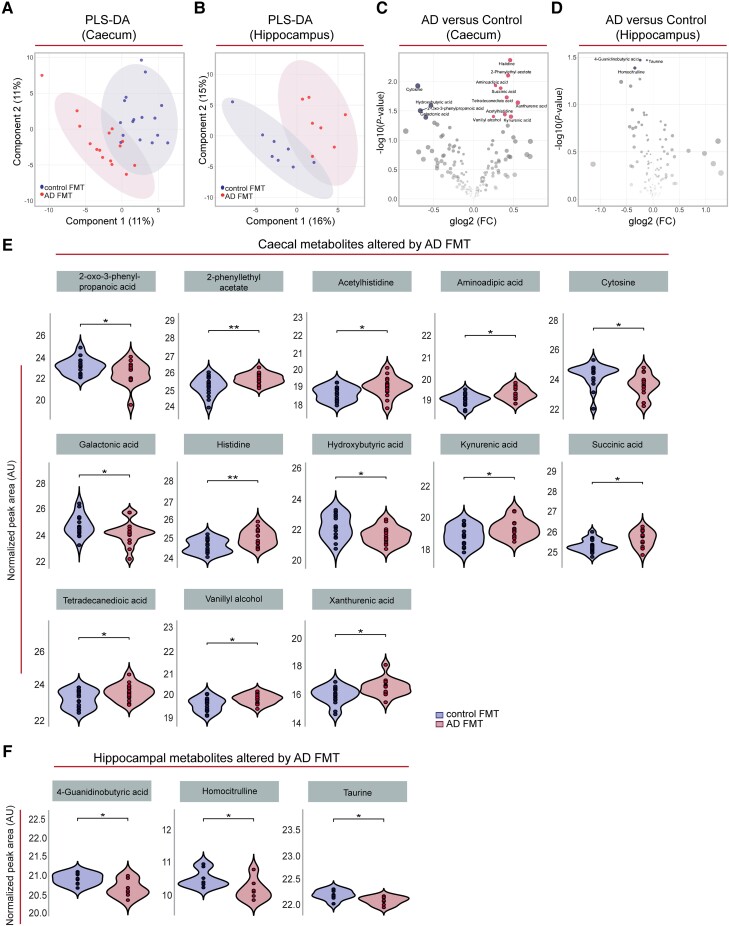
Figure 6.
FMT from Alzheimer’s patients induced alterations in the caecal and hippocampal metabolomes of young adult rats. (A and B) Partial least squares discriminant analysis (PLS-DA) plot depicting the effect of control and Alzheimer’s-FMT on the caecal content (A) and hippocampal (B) metabolomes of young adult rats (with 95% concentration ellipses). Both models were non-significant (pQ2 > 0.05) by n = 1000 permutation tests. (C and D) Volcano plots of metabolites quantified in caecal content (n = 184 features) (C) and hippocampal tissue (n = 123 features) (D) of rats colonized with control and Alzheimer’s-FMT. Red dots represent metabolites nominally (P < 0.05) upregulated in Alzheimer’s-FMT rats, and blue dots represent metabolites nominally (P < 0.05) upregulated in control FMT rats. (E and F) Violin and box-and-whisker plot (median represented by horizontal line) of normalized peak area of the caecal (n = 15–16) and hippocampal (n = 7–8) metabolites differentially regulated between rats receiving human FMT from control subjects and Alzheimer’s patients, as depicted in C and D. *P < 0.05, **P < 0.01 (unadjusted P-values from moderated t-tests, Limma). Histidine, P = 0.0043; 2-phenylethyl acetate, P = 0.0079; aminoadipic acid, P = 0.012; cytosine, P = 0.012; succinic acid, P = 0.013; tetradecanedioic acid, P = 0.019; xanthurenic acid, P = 0.023; hydroxybutyric acid, P = 0.026; 2-oxo-3-phenylpropanoic acid, P = 0.031; acetylhistidine, P = 0.036; vanillyl alcohol, P = 0.039; kynurenic acid, P = 0.040; galactonic acid, P = 0.041. 4-guanidinobutyric acid, P = 0.034; taurine, P = 0.034; homocitrulline, P = 0.041. AD = Alzheimer’s disease; FC = fold change; FMT = faecal microbiota transplantation; glog2 = generalized logarithm base 2.

