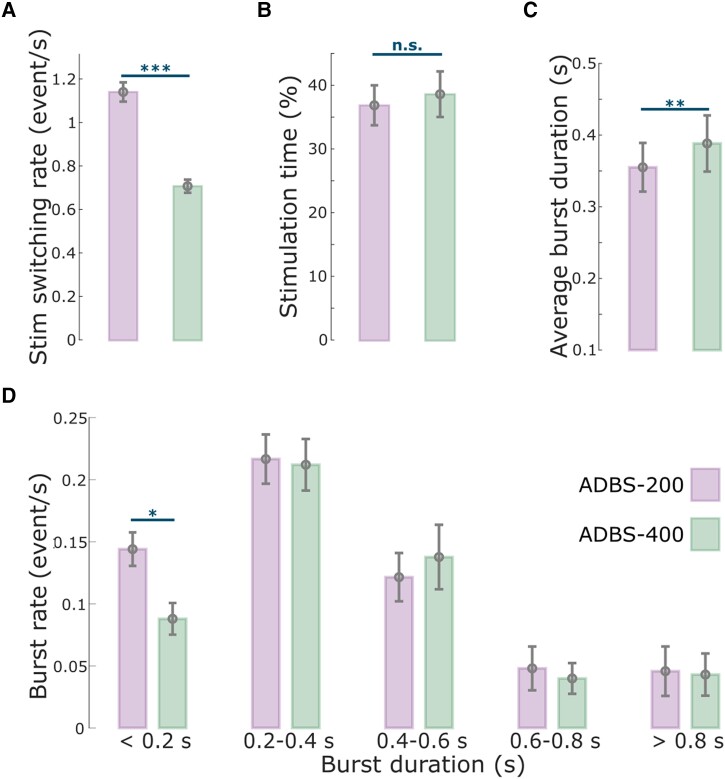
Figure 2.
Comparison of the stimulation events and beta bursts between ADBS-200 and ADBS-400 conditions. (A) Averaged stimulation switching rate, (B) percentage of time when the stimulation was on, (C) averaged duration of beta bursts and (D) averaged rate of beta bursts with different durations in ADBS-200 (purple) and ADBS-400 (green) conditions. The error bar plots show the mean and SEM across all tested hemispheres under different conditions. *P < 0.05; **P < 0.01; ***P < 0.001; P-values were quantified based on paired t-test on individual hemisphere basis (n = 16) and corrected for multiple comparisons using Bonferroni correction. ADBS = adaptive deep brain stimulation; n.s. = not significant; SEM = standard error of the mean.

