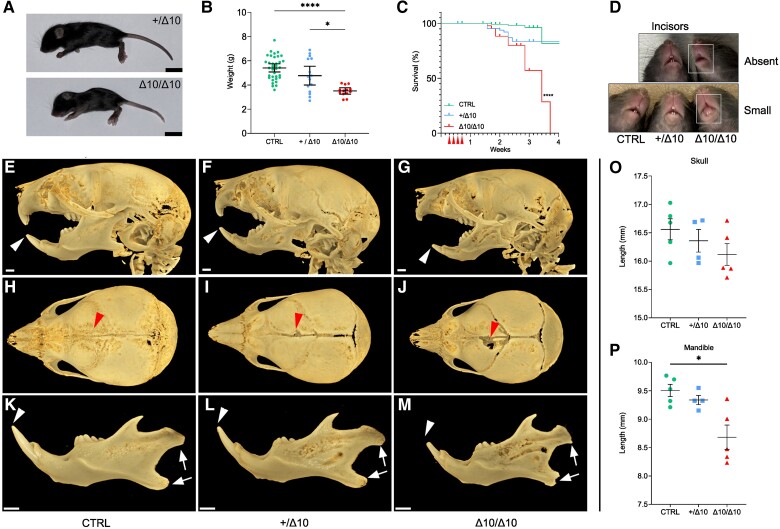
Figure 2.
Δ10 homozygous mice have reduced size and survival, as well as abnormal craniofacial development. (A) Representative size difference between +/Δ10 (top) and Δ10/Δ10 (bottom) littermates (Scale bar = 1 cm). (B) Weight of transgenic mice at the P21 end point where each point represents an individual mouse weight, including n = 13 Δ10/Δ10, n = 15 +/Δ10 and n = 35 CTRL mice. (C) Kaplan-Meier plot of survival of Δ10/Δ10 (n = 43) versus +/Δ10 (n = 72) and CTRL (n = 116). Median survival in Δ10/Δ10 was 24 days. Comparison of the survival curves and statistical significance were evaluated by Log-rank (Mantel-Cox) test (P < 0.0001). (D) Top: representative image of littermates where the Δ10/Δ10 (right) has apparent absence of incisors at P21. Bottom: representative image of three littermates where the Δ10/Δ10 (right) has small incisors at P21. (E–M) MicroCT analysis of Δ10/Δ10 mice at P18 demonstrated dental and craniofacial anomalies. (E–G) Lateral views demonstrate hypoplastic incisors (white arrowheads) and mandibles in Δ10/Δ10. (H–J) Dorsal views show deficiencies in the frontal bone (red arrowheads) in Δ10/Δ10 mice relative to +/Δ10 and CTRL. The skull length tends to be shorter in homozygous mice relative to controls (see O, below), but the differences were not statistically significant. (K–M) Isolated mandibles demonstrate general hypoplasia and an abnormal condylar head and mandibular angle shape (white arrows). (O and P) The incisors (white arrowheads) are small, and the length of the mandible is significantly shorter in homozygous mutants relative to controls. (O) Quantification of skull length, with biological replicates plotted as individual points. (P) Quantification of mandible length, with biological replicates plotted as individual points. The P-values in the plots in O and P were determined using Brown-Forsythe and Welch one-way ANOVA followed by multiple comparisons testing using the Dunnett T3 method with α = 0.05. Scale bar = 1 mm. *P < 0.05, **P < 0.01, ***P < 0.001, ****P < 0.0001. POLR3B-HLD = RNA polymerase III subunit B-related hypomyelinating leukodystrophy; Δ10/Δ10 = tamoxifen-treated transgenic mice carrying a Pdgfrα-CreERT allele and homozygous Polr3bfl alleles; +/Δ10 = tamoxifen-treated transgenic mice carrying a Pdgfrα-CreERT allele and heterozygous Polr3bfl alleles; CTRL = tamoxifen-treated transgenic mice carrying no Pdgfrα-CreERT allele(s).

