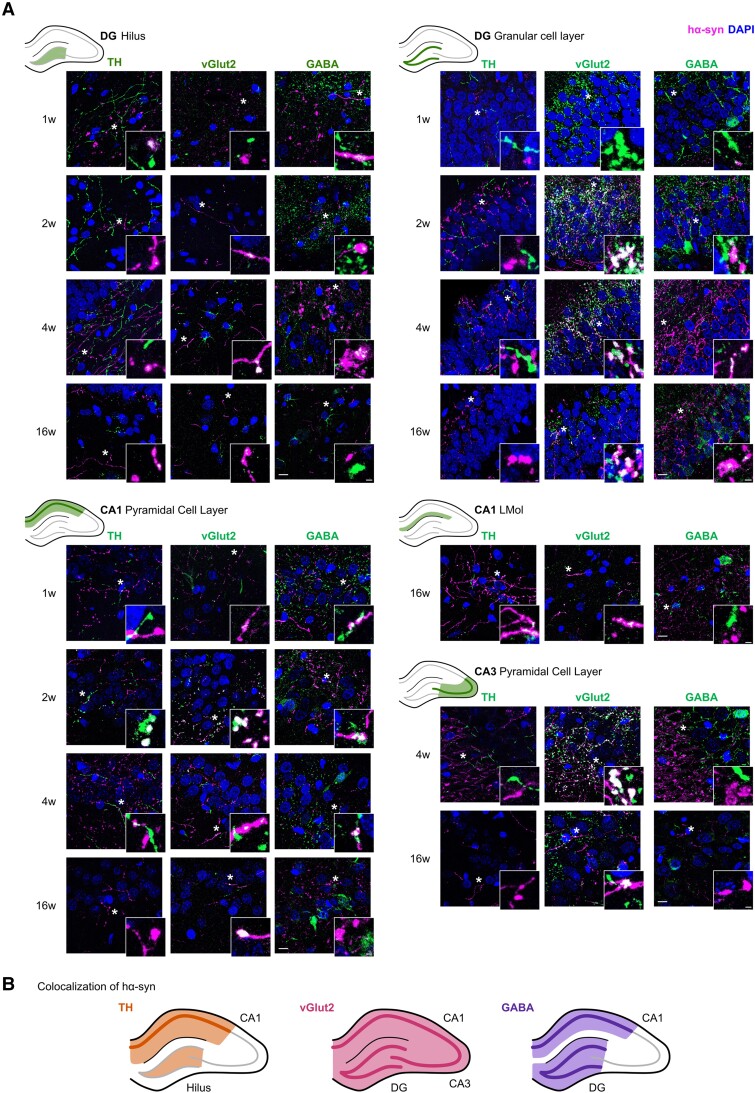
Figure 3.
Expression of hα-syn in dopaminergic (TH+), glutamatergic (vGlut2+) and GABAergic (GABA+) axon terminals in the hippocampus. (A) Representative double immunofluorescence photomicrographs for human α-synuclein (hα-syn) and tyrosine hydroxylase (TH), vGlut2 or GABA in the hilus and granular cell layer of the dentate gyrus (DG), pyramidal cell layer and stratum lacunosum-moleculare (LMol) of the CA1 region, or pyramidal cell layer of the CA3 region. Scale bar = 10 μm. Higher magnification photomicrographs of areas indicated by an asterisk are detailed in the bottom right corner of each photo. Scale bar = 5 μm (n = 4 for each group and time point). (B) Schematic representation of the co-localization of hα-syn with TH, vGlut2 or GABA in the distinct hippocampal areas. W = weeks.

