. 2023 Oct 2;29(23):4797–4807. doi: 10.1158/1078-0432.CCR-23-1860

Figure 4.

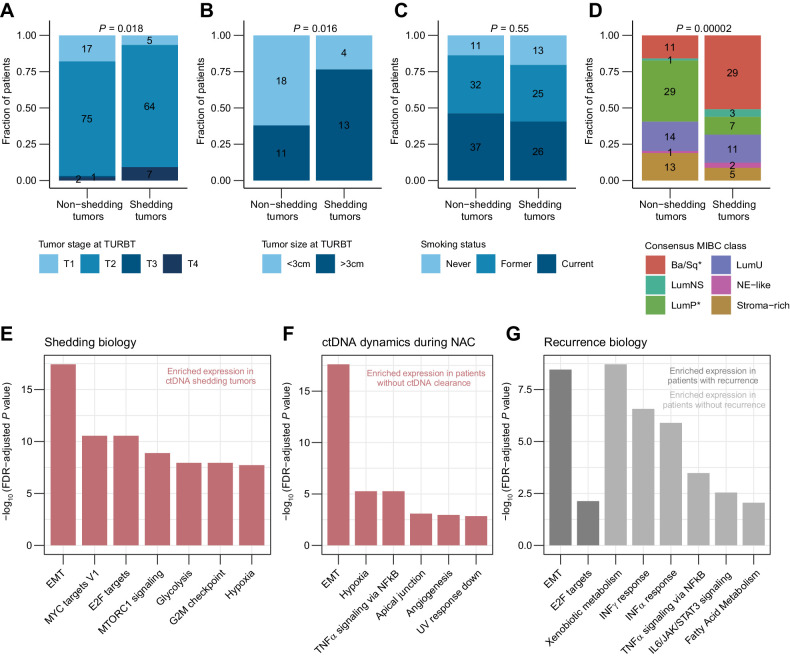
Figure 4. Clinical and biological characterization of ctDNA shedding tumors. A, Association between baseline ctDNA status and tumor stage at TURBT including both patient cohorts. B, Association between baseline ctDNA status and tumor size at TURBT including both patient cohorts. C, Association between baseline ctDNA status and smoking status of patients including both cohorts. D, Association between baseline ctDNA status and MIBC consensus classification of tumors including both patient cohorts. Asterisks in color legend indicate subtypes that were significantly associated with shedding when compared with all other subtypes. E, Gene set enrichment analysis of tumors using the Hallmark pathways comparing baseline ctDNA shedding and non-shedding tumors from both cohorts. Only gene sets with a normalized enrichment score >2 are shown. F, Gene set enrichment analysis of tumors using the Hallmark pathways comparing patients with and without ctDNA clearance after NAC. G, Gene set enrichment analysis of tumors using the Hallmark pathways comparing patients with and without recurrence within 1 year after RC. Statistical significance of ctDNA status and other categorical variables was calculated using Fisher exact test. Gene sets in E–G are ordered by decreasing q-values and only gene sets with q values < 0.01 are shown.

Clinical and biological characterization of ctDNA shedding tumors. A, Association between baseline ctDNA status and tumor stage at TURBT including both patient cohorts. B, Association between baseline ctDNA status and tumor size at TURBT including both patient cohorts. C, Association between baseline ctDNA status and smoking status of patients including both cohorts. D, Association between baseline ctDNA status and MIBC consensus classification of tumors including both patient cohorts. Asterisks in color legend indicate subtypes that were significantly associated with shedding when compared with all other subtypes. E, Gene set enrichment analysis of tumors using the Hallmark pathways comparing baseline ctDNA shedding and non-shedding tumors from both cohorts. Only gene sets with a normalized enrichment score >2 are shown. F, Gene set enrichment analysis of tumors using the Hallmark pathways comparing patients with and without ctDNA clearance after NAC. G, Gene set enrichment analysis of tumors using the Hallmark pathways comparing patients with and without recurrence within 1 year after RC. Statistical significance of ctDNA status and other categorical variables was calculated using Fisher exact test. Gene sets in EG are ordered by decreasing q-values and only gene sets with q values < 0.01 are shown.