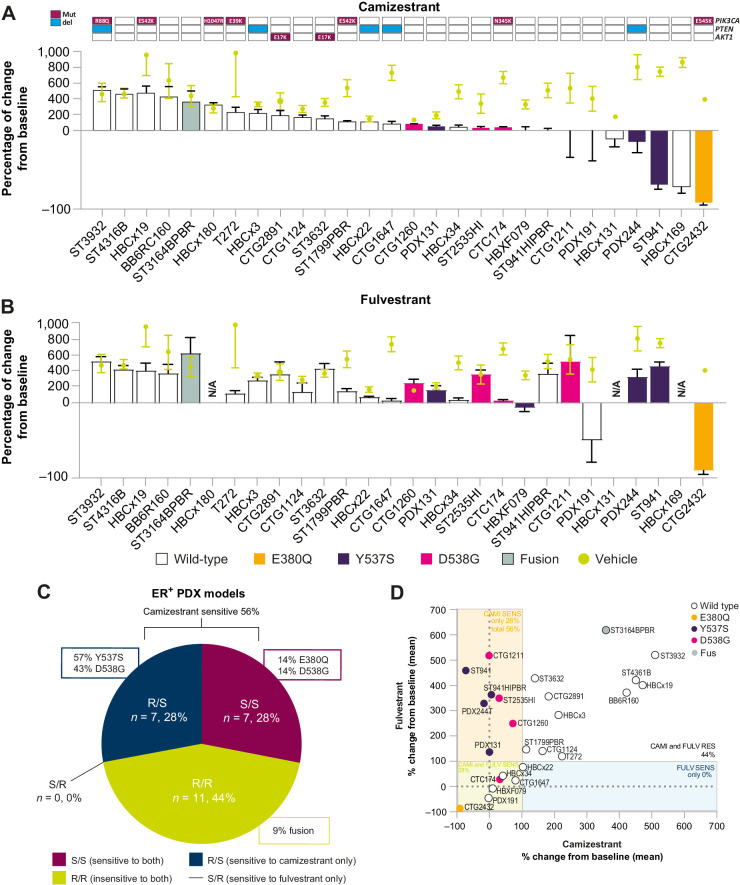
Figure 3.
Camizestrant has superior in vivo activity to fulvestrant in ESR1wt and ESR1m PDX models (1). A, Waterfall plot representing the growth of 28 of ER+ breast cancer PDX treated with camizestrant 10 mg/kg daily; bars are colored according to ESR1 mutational status and other genomic characteristics annotated at the top. The percentage change calculated from the initial volume at day of treatment is shown. Data represent mean ± SE of the mean. B, Waterfall plot representing the growth of 25 PDX treated with fulvestrant 5 mg/kg weekly. N/A denotes models where the head-to-head arm was not available. The percentage of change calculated from the initial volume at day of treatment is shown. Data represent mean ± SE of the mean. C, Pie chart indicates the proportions of PDX models sensitive or insensitive to camizestrant and/or fulvestrant. The antitumor response of camizestrant versus fulvestrant monotherapy is represented as the percentage of tumor change compared with the initial tumor volume, benchmarked to vehicle changes. D, Correlation of fulvestrant PDX antitumor response (y-axis) versus camizestrant (x-axis) in 25 PDX, represented as the percentage of tumor volume change compared with the initial tumor volume. Data represent mean. The boxes indicate the percentage change from baseline ≤100%; the percentage of models sensitive only to fulvestrant or camizestrant, or sensitive to both is represented in each box.

